Over 2 million + professionals use CFI to learn accounting, financial analysis, modeling and more. Unlock the essentials of corporate finance with our free resources and get an exclusive sneak peek at the first module of each course.
Start Free
What is an Actuarial Life Table?
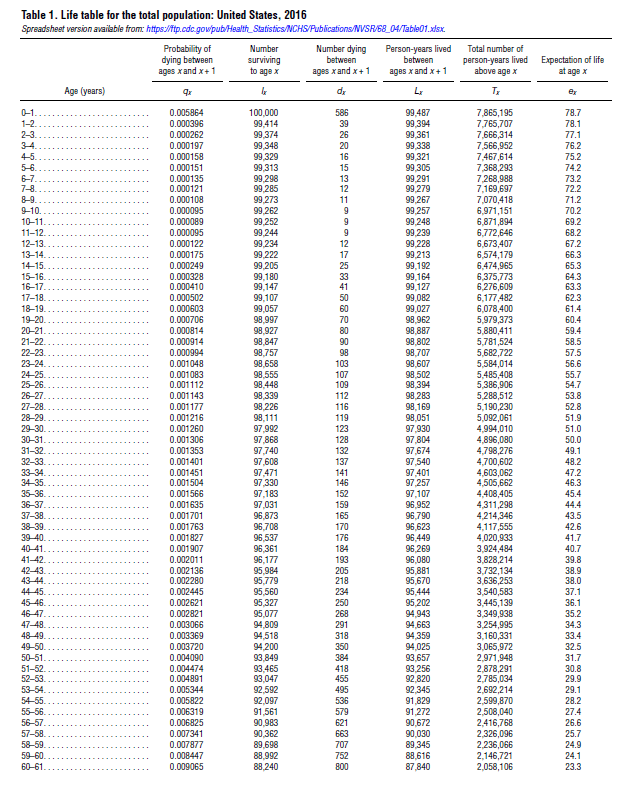
An actuarial life table is a table that displays the probability that a person of specific age will die before their next birthday. The tables are in spreadsheet form and essentially demonstrate the probability of death for each age group within a population. In the long term, the table can also be utilized to explain mathematically the measurement of a population’s longevity in terms of their lifetime before death.
As actuarial life tables include the intertwining of actuarial science and demography, demographers such as Graunt, Greville, and Keyfitz played a role in the development of the tables. It is important to note that actuarial life tables can also be known simply as life tables or mortality tables, and they can be divided into two different types – period life tables and cohort life tables.
Actuarial life tables can be constructed through the use of future mortality rate projections, but typically, they are created with age-specific mortality rates brought from the recent past. Therefore, one can deduce that the life tables are based on current medicine and safety standards.
Also, the tables are created without consideration of immigration and emigration since they ideally will look at a certain population within a closed demographic system. It’s interesting to note that life tables are typically created separately for men and women because of their variance in mortality rates. Moreover, life tables can be intertwined with additional information such as health information and health expectancy.
Summary
Actuarial life tables display the probability that a person will die at a specific age.
The tables are useful for future mortality rate projects and populations.
The two types of actuarial life tables are period life tables and cohort life tables.
Understanding the Different Types of Actuarial Life Tables
Actuarial tables are of two main types – the period life table and the cohort life table.
1. Period life table
The period life table, also known as a static life table, demonstrates the mortality rates of a specific time period with a specific population. Therefore, it shows the current probability of death. Interestingly, for static life tables, individuals are assumed to be a stationary population with overlapping generations.
On the other hand, a cohort life table – otherwise known as a generation life table – will display the overall mortality rates of a specific population’s entire lifetime. Within the cohort life table, it is required that an individual must be born within a specific time period. The table will demonstrate the probability of death of the people within a certain cohort – usually birth year – over their lifetime.
2. Cohort table
Generally, the cohort life table is used more often because it is able to make predictions regarding expected changes in mortality rates of a certain population in the future. Additionally, the cohort life table takes precedence because it provides the ability to analyze patterns within mortality rates over a period of time.
It’s important to note that for the cohort life tables, data can only be constructed through the use of data up to the current point and projections of mortality in the future. Overall, both types of actuarial life tables are based on an actual and present population and are demonstrated through an educated prediction.
Period Life Table
Cohort Life Table
Also known as static life table
Also known as generation life table
Specific time period
Overall mortality rate
Specific population
Specific population
Shows current probability of death
Entire lifetime
Born with specific time period
Weaknesses and Assumptions
It’s important to underline some weaknesses and assumptions within actuarial life tables. Firstly, they do not acknowledge the overall health of the population. Secondly, they do not consider immigration and emigration. As globalization continues, emigration and immigration will affect the ability of life tables to predict future mortality rates. Thirdly, it separates men and women.
Importance of Actuarial Life Tables
Actuarial life tables are important for multiple reasons. First, our healthcare systems need to study and acknowledge mortality rates within a population. It is imperative because it can help in projecting future populations based on mortality rates.
Additionally, it can be used to help with the prediction of populations or demographics and aid in comparing results nationally or internationally. Finally, actuarial life tables are vital to insurance companies that utilize the tables to project future insured events, such as death or disability.
Additional Resources
CFI is the official provider of the global Commercial Banking & Credit Analyst (CBCA)™ certification program, designed to help anyone become a world-class financial analyst. To keep advancing your career, the additional resources below will be useful:
Take your learning and productivity to the next level with our Premium Templates.
Upgrading to a paid membership gives you access to our extensive collection of plug-and-play Templates designed to power your performance—as well as CFI's full course catalog and accredited Certification Programs.
Gain unlimited access to more than 250 productivity Templates, CFI's full course catalog and accredited Certification Programs, hundreds of resources, expert reviews and support, the chance to work with real-world finance and research tools, and more.