Get Certified for
Business Intelligence (BIDA®)
Develop analytical superpowers by learning how to use programming and data analytics tools such as VBA, Python, Tableau, Power BI, Power Query, and more.
A form of a frequency distribution that represents the sum of a class and all classes below it
Cumulative frequency distribution is a form of frequency distribution that represents the sum of a class and all classes below it. Remember that frequency distribution is an overview of all distinct values (or classes of values) and their respective number of occurrences.
The cumulative frequency distribution is extremely helpful when we need to determine the frequency up to a certain threshold.
A cumulative frequency table is a simple visual representation of the cumulative frequencies for each distinct value or category.
Consider the following example. As a financial analyst in an e-commerce company, you want to understand how frequently customers purchase your products that are priced up to $500.
Your problem can be solved using the cumulative frequency table. The table can be easily built by following the steps below:
1. Find the individual frequencies for each distinct value or category.
2. Arrange the obtained data in ascending order.
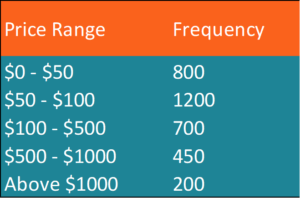
3. The cumulative frequency of a distinct category (in our example, a price range) is calculated by finding the sum of a category’s frequency and the total frequencies of all categories below it. Note that the cumulative frequency of the first category equals the category’s individual frequency.
Let’s find the cumulative frequencies for a few categories in our example:
Cumulative Frequency ($0-$50) = 800
Cumulative Frequency ($50-$100) = 800 + 1200 = 2000
Cumulative Frequency ($100-$500) = 800 + 1200 + 700 = 2700
Our cumulative frequency table should look like the one below:
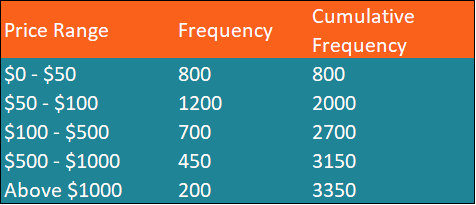
Using the table above, you can easily identify that customers 2,700 times purchased products with prices up to $500.
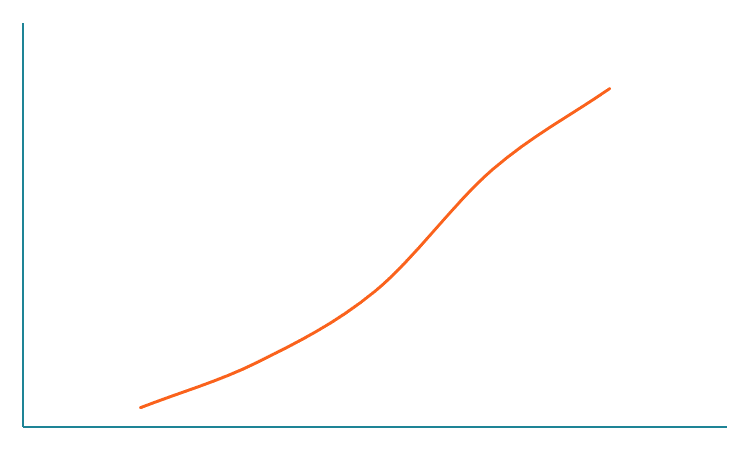
A cumulative frequency distribution graph is another powerful tool to visualize the cumulative frequency distribution. The graph can be created as an addition to the cumulative frequency distribution table. It can be easily done using Microsoft Excel.
The creation of the cumulative frequency distribution graph involves the following steps:
1. Create the cumulative frequency distribution table in Excel using the steps described in the previous section.
2. In the table, select the columns that contain the names of values or categories and the column that contains the cumulative frequencies. Select Insert -> Charts -> Scatterplot -> Scatter with Smooth Lines (or Scatter with Straight Lines).
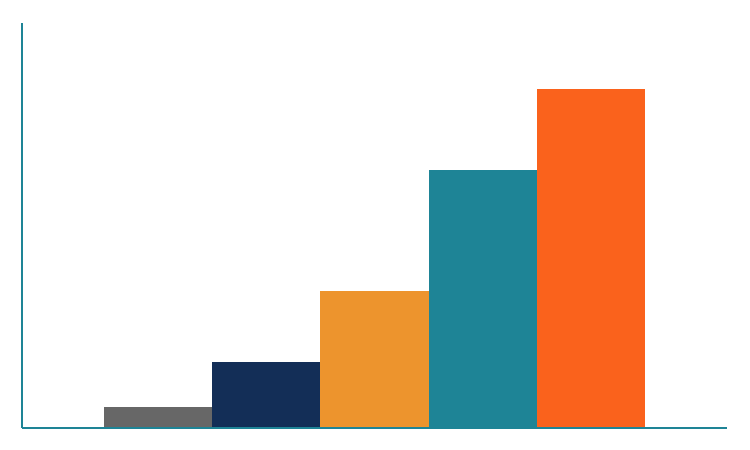
Alternatively, you can select Insert -> Charts -> Bar Chart -> Clustered Columns. This method creates a simple histogram.
CFI offers the Business Intelligence & Data Analyst (BIDA)® certification program for those looking to take their careers to the next level. To keep learning and advancing your career, the following CFI resources will be helpful:


