Sample Statistic

A figure that is computed from a sample of data

Over 2 million + professionals use CFI to learn accounting, financial analysis, modeling and more. Unlock the essentials of corporate finance with our free resources and get an exclusive sneak peek at the first chapter of each course. Start Free

What is a Sample Statistic?

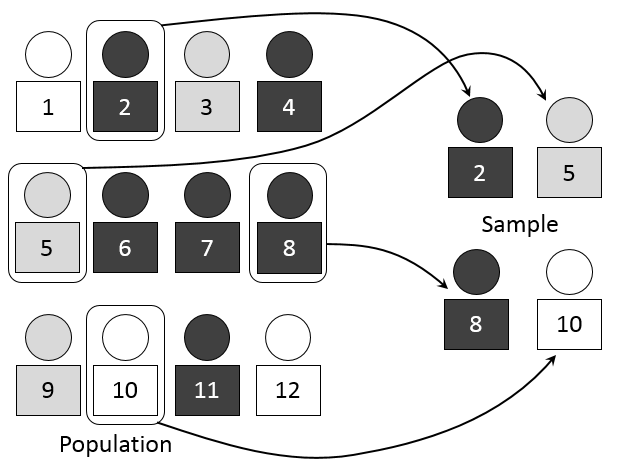
A sample statistic is a figure that is computed from a sample of data. A sample is a piece or set of objects taken from a statistical population. In other words, a sample statistic is just a calculation taken from a sample that is just a piece of a population. A sample is ideally an accurate representation of the entire population, and a sample statistic would ideally be an accurate summary of the entire population.

Sample Statistic

Further, sample statistics are typically used in quantitative analysis and statistics. The population from which a sample is taken is typically very large, like a census; it may be very difficult to interpret or impossible to gather all the data of a population. Thus, a sample is taken to represent the population and present the ability to manage and work with the data. Then, a sample statistic is taken to run an analysis or conduct research.

Uses of a Sample Statistic

The main uses for sample statistics are for quantitative research and analysis. Sample statistics are often used in regression models to predict variables. However, a sample statistic is a very broad term. A sample statistic can be anything from an average (mean) of a variable of a sample to the standard deviation of a variable.

Also, sample statistics can provide an unbiased estimator of a population; for example, the average of a sample would be the unbiased estimate of a population’s average. Thus, sample statistics are very valuable in predictive statistical models.

An example of a sample statistic’s use in a predictive regression would be using the average returns of a sample of companies from an index over a certain time frame to predict the returns of a specific asset. In such a case, the average returns of the sample companies over a certain time frame would be a sample statistic.

Additionally, sample statistics can also be used in event studies to analyze the effect of an event. It is commonly used in finance and can be applied to analyze the potential impact of an earnings surprise on the returns of an asset. Here, the sample can be a group of companies in a major index. The sample statistic can be the average of the companies’ returns one month after a positive earnings surprise.

Functions Used to Calculate Sample Statistics

As mentioned above, sample statistics can be very broad. Thus, there are many different functions used to calculate sample statistics.

The following are commonly used functions: sample mean, sample variance, sample quartiles, standard errors, t statistics, and sample minimums and maximums. Most spreadsheet programs and programming languages come with embedded functions; however, the functions can also be calculated manually.

When working with sample statistics, it is important to ensure that the sample which you are working off of is truly representative of the population. If the sample is not representative of the population, the statistic derived from that sample will not be valid in conveying information about the population.

Also, when calculating sample statistics, it is important to also calculate confidence intervals or other statistical measures of uncertainty to understand the validity of the calculated sample statistic.

Examples

Sample statistics are commonly used in economics and finance. One example is analyzing whether the federal funds rate can predict the returns of a market portfolio.

To conduct such an analysis, one can run a predictive linear regression with the dependent variable being the monthly returns of the S&P 500 at time t+k, and the independent variable being the monthly federal funds rate at time t. The monthly returns of the S&P 500 are the sample statistic as the S&P 500 is a sample of the market portfolio, and the monthly returns of the S&P 500 are a statistic.

Learn More

Thank you for reading CFI’s guide to Sample Statistic. To keep advancing your career, the additional CFI resources below will be useful:

0 search results for ‘