Get Certified for
Business Intelligence (BIDA®)
Develop analytical superpowers by learning how to use programming and data analytics tools such as VBA, Python, Tableau, Power BI, Power Query, and more.
A tool used to help calculate and provide a visual representation of probabilities
A tree diagram is used in mathematics – more specifically, in probability theory – as a tool to help calculate and provide a visual representation of probabilities. The outcome of a certain event can be found at the end of each branch in the tree diagram.
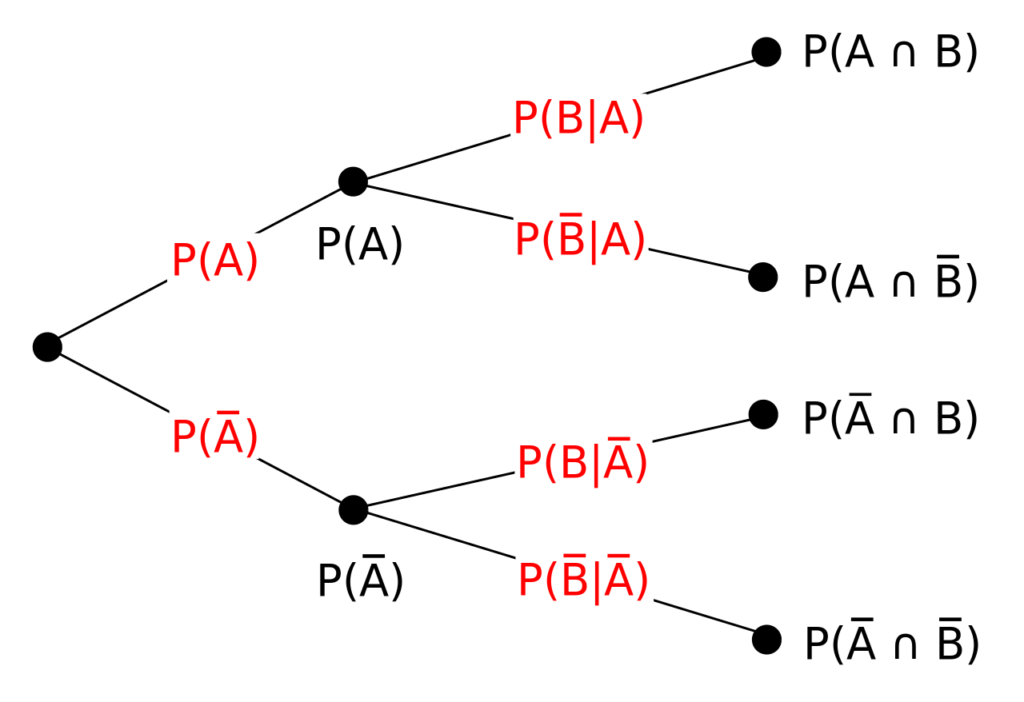
There are generally two types of events represented within tree diagrams. They are:
Otherwise known as “dependent events,” conditional probabilities are the typically increased chances of an event taking place because another event has already happened. More specifically, conditional (dependent) events usually only occur if/when other event(s) occur.
Independent events have no effect on the occurrence or probability of other events; also, their probability of occurrence is not dependent on or influenced by the occurrence of other events.
Each tree diagram starts with an initial event, otherwise known as the parent. From the parent event, outcomes are drawn. To keep it as simple as possible, let’s use the example of flipping a coin. The act of flipping the coin is the parent event.
From there, two possible outcomes can occur: drawing heads or drawing tails. The tree diagram would look like this:

The tree can be extended – almost infinitely – to account for any additional probabilities. For example:

The second string of possibilities represents a second coin toss; the first can be either heads or tails. However, if it is heads, there are two possible outcomes for the second toss, and if it is tails, there are two possible outcomes. Now, on to calculating the probabilities.
Calculating probabilities typically involves addition or multiplication. However, knowing which to do and when is crucial. Let’s use the example above.
Each branch on the tree is the line drawn from one arrow to the next. With the event of flipping a coin, because there are only two possible outcomes, each outcome has a 50% (or 0.5) possibility of occurring. So, for the example above, the probability of flipping tail, then tail again, is 0.25 (0.5 x 0.5 = 0.25). The same is true for:
In order to verify that the probabilities are correct, add the list of total probabilities. In this case, 0.25 + 0.25 + 0.25 + 0.25 = 1.0. When added together, all probabilities should equal to 1.0.
To keep advancing your career, the additional CFI resources below will be useful:


