Get Certified for
Business Intelligence (BIDA®)
Develop analytical superpowers by learning how to use programming and data analytics tools such as VBA, Python, Tableau, Power BI, Power Query, and more.
The expected deviation between values in a specific data set
Variance refers to the expected deviation between values in a specific data set. It measures the spread of each figure from the average value. Traders and market analysts often use variance to project the volatility of the market and the stability of a specific investment return within a period. Mostly, variance is illustrated by the symbol σ², while its square root – i.e., the standard deviation – is depicted by σ.

Variance is a key concept used by investors to measure the risk and reward associated with a particular investment. Generally, it is used as a relative tool for performance comparison between assets in a data profile to achieve a superior asset allocation.
Variance is calculated by squaring the change between the average mean and the values in the data profile and then dividing the square sum with the average number of values in the portfolio.
Large variability is an indication of a huge spread of values in the number set. However, a minimum variance illustrates a close proximity of figures between each other and from the mean value. Identical values within a data set portray a zero variance. Similarly, every positive number indicates a non-zero variance since a square value cannot be negative.
As a financial expression, the variability equation is a comparative formula for determining the overall functioning of values in a set against the mean and other values. Variance analysis may also be used to approximate population variability. Variance is expressed mathematically using the following formula:
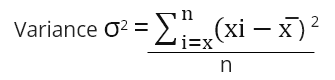
Where:
The following example shows how variance functions:
The investment returns in a portfolio for three consecutive years are 10%, 25%, and -11%. The average mean of the returns is 8%. The differences between each yield and the mean are 2%, 17%, and -3% for each successive year.
Generally, squaring each deviation will produce 4%, 289%, and 9%. After adding up the squared deviations, they give a total of 302%. By dividing the total additional sum by the number of values in the number set, the variance will be 100.67%. Calculating the square root of the variance will generate the standard deviation of 10.03% of the investment returns.
Var (X) ≥ 0
Var (k) = 0
Var (X + k) = Var(X)
Var(kX) = k2 Var(X)
Variance homogeneity is a key concept used in analyzing parametric tests. The tests are performed with equal variances referred to as homoscedasticity used in determining different sample tests. Unequal variances produce biased test results between samples.
However, non-parametric tests may be done with unequal variances across test samples. Similarly, analysis of variance is a statistical test used in assessing population differences.
Market statisticians prefer using variance analysis when analyzing the relationship between individual values within a number set rather than using extensive mathematical methodologies, such as arraying figures in quartiles. Every deviation originating from the mean value to any direction is portrayed similarly; therefore, the squared deviation giving an expression non-variability in the data set cannot sum up to zero.
However, a variance may manipulate the data by squaring the numbers isolated from the mean value, which are referred to as outliers. Most investors prefer using the standard deviation to assess the consistency of returns since it is easily expressed rather than variance, which may be difficult to interpret.
The standard deviation shows the position of each value from the mean. Similarly, both standard deviation and variance demonstrate variability in a number set. However, a variance is indicated in larger units, such as meters squared, while the standard deviation is expressed in original units, such as meters.
Due to the larger unit values of expression, a variance number becomes harder to interpret, with many traders opting for standard deviation as a key measure of variability. However, while making statistical analysis, a variance is preferred since it’s more descriptive about variability than the standard deviation.
CFI offers the Business Intelligence & Data Analyst (BIDA)® certification program for those looking to take their careers to the next level. To keep learning and developing your knowledge base, please explore the additional relevant resources below:


