Bollinger Bands®

Volatility bands placed above and below a moving average

Over 2 million + professionals use CFI to learn accounting, financial analysis, modeling and more. Unlock the essentials of corporate finance with our free resources and get an exclusive sneak peek at the first module of each course. Start Free

What are Bollinger Bands?

Bollinger Bands are a technical analysis tool developed by John Bollinger in the 1980s for trading stocks. The bands comprise a volatility indicator that measures the relative high or low of a security’s price in relation to previous trades. Volatility is measured using standard deviation, which changes with increases or decreases in volatility. The bands widen when there is a price increase, and narrow when there is a price decrease. Due to their dynamic nature, Bollinger Bands can be applied to the trading of various securities.

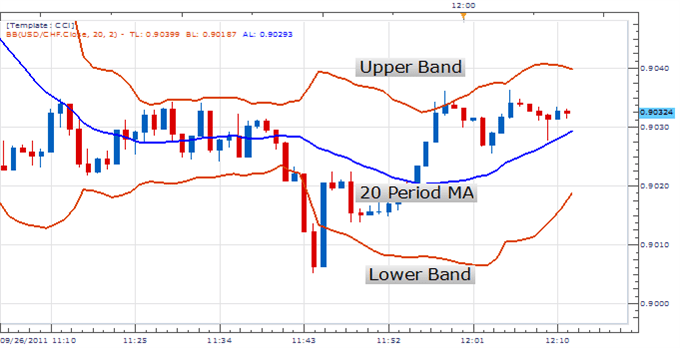
Bollinger Bands Chart

Bollinger Bands are comprised of three lines – the upper, middle, and lower band. The middle band is a moving average, and its parameters are chosen by the trader. The upper and lower bands are positioned on either side of the moving average band. The trader decides the number of standard deviations they need the volatility indicator set at. The number of standard deviations, in turn, determines the distance between the middle band and the upper and lower bands. The position of these bands provides information on how strong the trend is and the potential high and low price levels that may be expected in the immediate future.

Day Trading Uptrends With Bollinger Bands

Bollinger Bands can be used to determine how strongly an asset is rising and when it is potentially reversing or losing strength. If an uptrend is strong enough, it will reach the upper band regularly. An uptrend that reaches the upper band indicates that the stock is pushing higher and traders can exploit the opportunity to make a buy decision.

If the price pulls back within the uptrends, and it stays above the middle band and moves back to the upper band, that indicates a lot of strength. Generally, a price in the uptrend should not touch the lower band, and if it does, it is a warning sign for a reverse or that the stock is losing strength.

Most technical traders aim to profit from the strong uptrends before a reversal occurs. Once a stock fails to reach a new peak, traders tend to sell the asset at this point to avoid incurring losses from a reversed trend. Technical traders monitor the behavior of an uptrend to know when it shows strength or weakness, and they use this as an indication of a possible trend reversal.

Day Trading Downtrends With Bollinger Bands

Bollinger Bands can be used to determine how strongly an asset is falling and when it is potentially reversing to an upside trend. In a strong downtrend, the price will run along the lower band, and this shows that selling activity remains strong. But if the price fails to touch or move along the lower band, it is an indication that the downtrend may be losing momentum.

When there are price pullbacks (highs), and the price stays below the middle band and then moves back to the lower band, it is an indication of a lot of downtrend strength. In a downtrend, prices should not break above the upper band since this would indicate that the trend may be reversing, or it is slowing.

Many traders avoid trading during downtrends, other than looking for an opportunity to buy when the trend begins to change. The downtrend can last for short or long durations – either minutes, hours, weeks, days, months, or even years. Investors must identify any sign of downtrends early enough to protect their investments. If the lower bands show a steady downtrend, traders must be cautious to avoid entering into long trades that will prove unprofitable.

Trading W-Bottoms and M-Tops

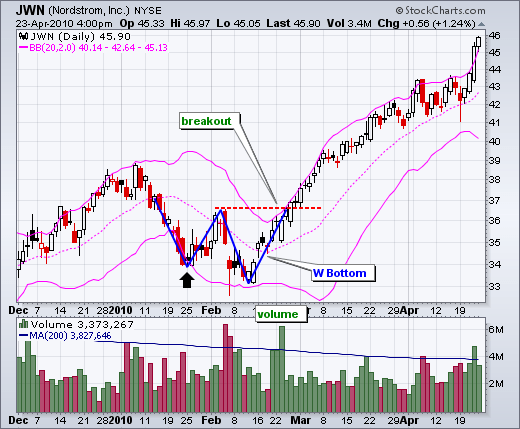
W-Bottoms and M-Tops were part of Arthur Merrill’s work that identifies 16 patterns with a basic W-Pattern and M-Pattern, respectively. Bollinger Bands use W patterns to identify W-Bottoms when the second low is lower than the first low but holds above the lower band. It occurs when a reaction low forms close to or below the lower band.

The price then pulls back towards the middle band or higher and creates a new price low that holds the lower band. When the price moves above the high of the first pullback, the W-button is in place as shown in the figure below, and indicates that the price will likely rise to a new high.

Bollinger Bands - Trading W-Bottoms and M-Tops
Source: Stockcharts.com

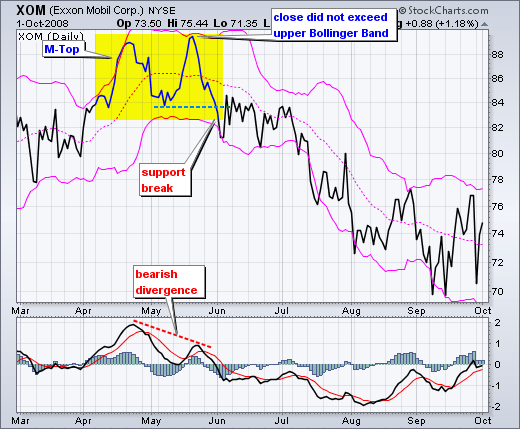
John Bollinger used the M patterns with Bollinger Bands to identify M-Tops. In its basic form, an M-Top is similar to a Double Top chart pattern. An M-Top occurs when there is a reaction that moves close to or above the upper band. The price then pulls back towards the middle band or lower and creates a new price high, but does not close above the upper band. If the price then moves below the low of the prior pullback, the M-Top is in place as shown in the figure below.

Bollinger - Chart
Source: Stockcharts.com

Limitations of Bollinger Bands

Although Bollinger Bands are helpful tools for technical traders, there are a few limitations that traders should consider before using them. One of these limitations is that Bollinger Bands are primarily reactive, not predictive. The bands will react to changes in price movements, either uptrends or downtrends, but will not predict prices. In other words, like most technical indicators, Bollinger Bands are a lagging indicator. This is because the tool is based on a simple moving average, which takes the average price of several price bars.

Although traders may use the bands to gauge the trends, they cannot use the tool alone to make price predictions. John Bollinger, the Bollinger Bands’ developer, recommends that traders should use the system along with two or three non-correlated tools that provide more direct market signals.

Another limitation of Bollinger Bands is that the standard settings will not work for all traders. Traders must find settings that allow them to set guidelines for specific stocks that they are trading. If the selected band settings fail to work, traders may alter the settings or use a different tool altogether. The effectiveness of Bollinger Bands varies from one market to another, and traders may need to adjust the settings even if they are trading the same security over a period of time.

To learn more about Bollinger Bands, visit https://www.bollingerbands.com/

Additional Resources

Thank you for reading CFI’s guide on Bollinger Bands®. To keep advancing your career, the additional CFI resources below will be useful:

0 search results for ‘