Get Certified for
Capital Markets (CMSA®)
From equities and fixed income to derivatives, the CMSA certification bridges the gap from where you are now to where you want to be — a world-class capital markets analyst.
A volatility-based indicator that identifies stop loss exit points for long and short trading positions
Chandelier Exit (CE) is a volatility-based indicator that identifies stop loss exit points for long and short trading positions. Chuck Le Beau, a recognized expert in exit strategies, developed the CE indicator. However, Alexander Elder introduced the strategy to traders through his book “Come into My Trading Room,” which was published in 2002. Chandelier Exits borrow their name from chandeliers that hang from the ceiling of a house.

Chandelier Exit is based on the Average True Range (ATR) indicator. It is designed to keep traders in the trend until a defined trend reversal happens. Traders use CE to maximize their returns in a trade and make stop loss exit decisions. It is based on the principle that a trend reversal is highly probable when the price of an asset moves against an existing trend up to three times the average volatility. It uses the high and low prices over a defined period of time to compute the CE value.
The main objective of using Chandelier Exit is to alert the trader to a possible trend reversal after an extended trend. During lower volatility trading sessions, traders set small trailing stop losses. This allows them to close their trades near the top and get maximum returns on their investments. The possibility of a trend reversal is low during low volatility trading sessions. However, in higher volatility trading, traders set a larger trailing loss in order to protect themselves from choppy trading.
Due to the close relationship between stop loss and volatility, traders use Chandelier Exit as a trailing stop-loss and as a way of protecting themselves from losses resulting from trend reversals. Most professional traders recommend using Chandelier Exit as a stop loss tool rather than as a tool for generating trading signals. This is because as a trading signal it is prone to generating false signals.
When using Chandelier Exit for technical analysis, Charles Le Beau recommended setting an input period of 22 and a multiple of 3 times the Average True Range. The reason for using an input period of 22 is that there are usually 22 trading days in a month. Using 22 price levels allows for short-term fluctuations in price. However, experienced traders have the freedom to choose different settings depending on their risk tolerance and trading style.
Chandelier Exits show two lines – the chandelier exit long and the chandelier exit short. The exit long is used to close long positions whereas the exit short is used to close short positions. Therefore, the rule of the indicator is to close long positions when the price goes below the exit long and to close short positions when the price goes above exit short.
The Chandelier long and short are used to compute the value of ATR. Then, using the recommended setting of 22 periods, the Chandelier exit will calculate the highest high or the lowest low for the same period used to calculate ATR. Lastly, subtract the multiple ATR from the figure obtained for the highest high, and add multiple ATR to the value obtained for the lowest low.
The formulas for the two lines are as follows:
Chandelier Exit Long: n-day Highest High – ATR (n) x Multiplier
Chandelier Exit Short: n-day Lowest Low + ATR (n) x Multiplier
Where:
An uptrend occurs when the price of a security moves in an upward direction, and each successive peak and trough is higher than others below it. An uptrend allows traders to maximize their returns from the security before a trend reversal occurs. The Chandelier Exit is used to identify an uptrend and set a trailing stop low. After spotting the possible trend reversal point, a trader can find another technical analysis indicator that triggers buy signals within the trend.
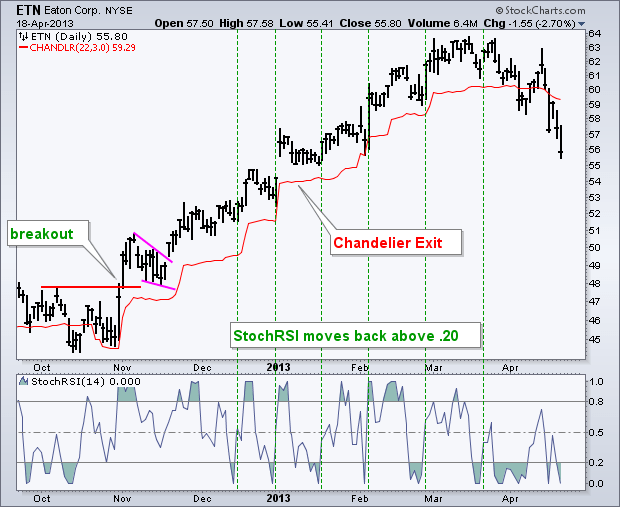
The chart below shows ETN Eaton Corporation breaking out and starting an uptrend. The indicator identified the uptrend in the company’s stocks and followed the price action as it rose steadily.
A downtrend occurs when the price of a security declines over a period of time. It is characterized by lower peaks and troughs. Traders should be quick to avoid downtrends since a continuous downtrend can negatively affect the value of a security. Traders use technical indicators like Chandelier Exits to spot and confirm downtrends.
Chandelier Exits can be used alongside the Relative Strength Index that shows the strength of a downtrend and helps a trader decide whether or not to enter a short position. The following chart shows HPQ Hewlett-Packard Co.’s stocks which experienced a downtrend in 2012:
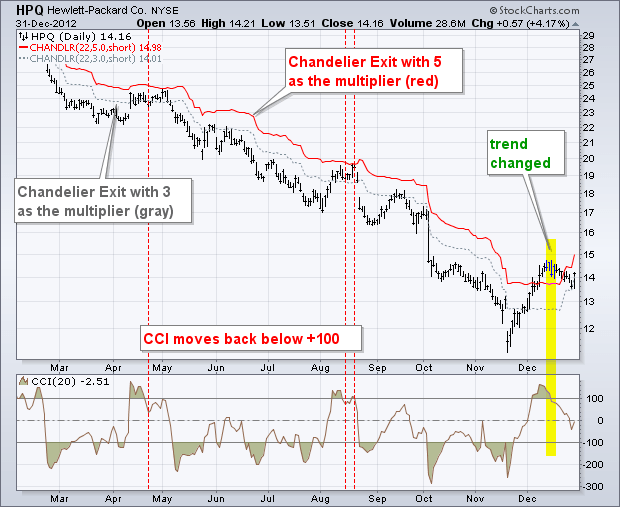
Tech stocks are usually more volatile than others, and this means that the multiplier should be increased. In the chart, a Chandelier Exit with an input period of 22 and a multiple of 3 would’ve triggered some stop loss before the trend continued. Increasing the multiplier from 3 to 5 allows for more volatility. The company held the increased multiplier until a breakout that marked the end of a downtrend and the start of an uptrend.
Thank you for reading CFI’s guide on Chandelier Exit. To keep learning and advancing your career, the following resources will be helpful:


