Get Certified for
Capital Markets (CMSA®)
From equities and fixed income to derivatives, the CMSA certification bridges the gap from where you are now to where you want to be — a world-class capital markets analyst.
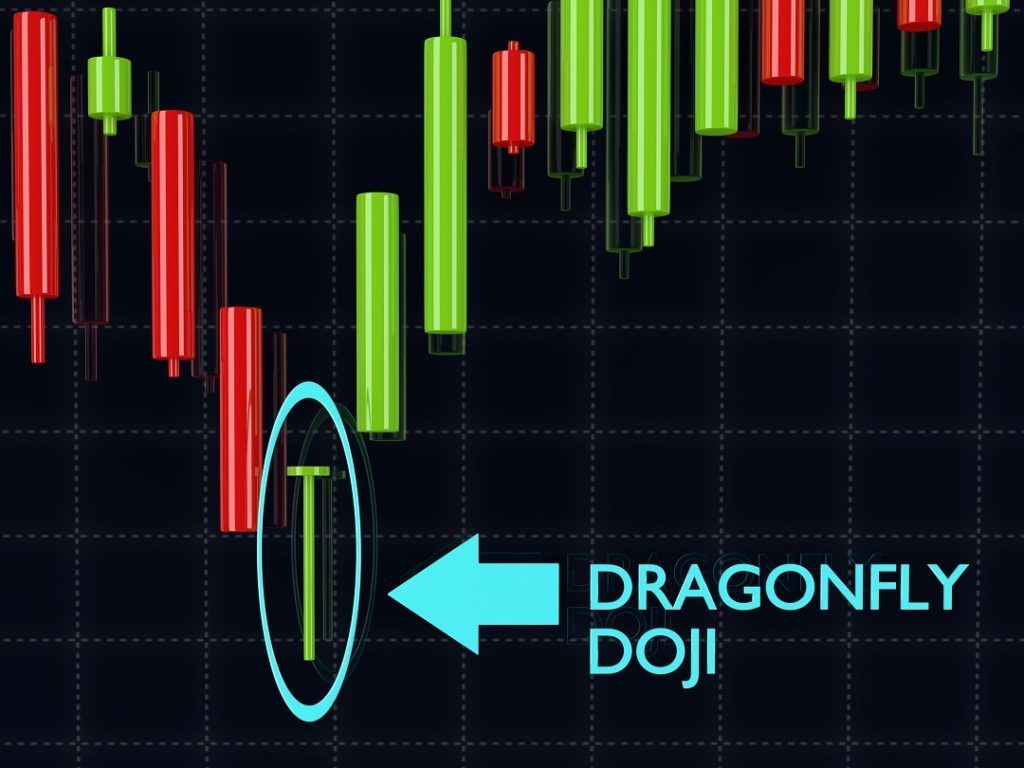
A candlestick pattern with the open, close, and high prices of an asset at the same level
A dragonfly doji candlestick is a candlestick pattern with the open, close, and high prices of an asset at the same level. A dragonfly doji pattern does not appear constantly. It is used as a technical indicator that signals a potential reversal of the asset’s price.
What is a Doji Candlestick?
Candlestick is a type of charting that contains the open, close, high, and low prices of an asset for a specific time period. Candlestick charts are more informative than typical line charts, which only provide the close price or average price. Thus, candlestick charts are more prevalently used in technical analysis than line charts.
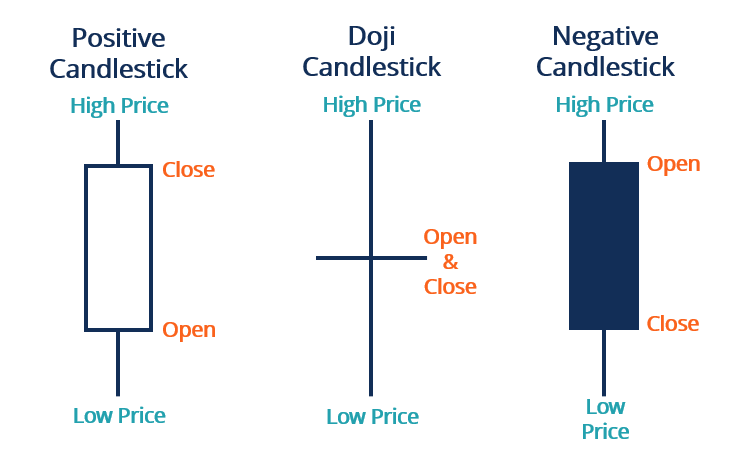
A candlestick consists of two parts – “the body” and the “tails.” The top of the upper tail tells the highest price that the asset has ever been traded at during a certain period of time. The bottom of the lower tail tells the lowest asset price traded during that period.
The body of a candlestick tells the open and close prices. The body can either be filled (negative candlestick) or hollow (positive candlestick). The top of a hollow body represents the close price, as the bottom represents the open price, which indicates a price increase during that period. Conversely, a filled body indicates a drop in the asset price.
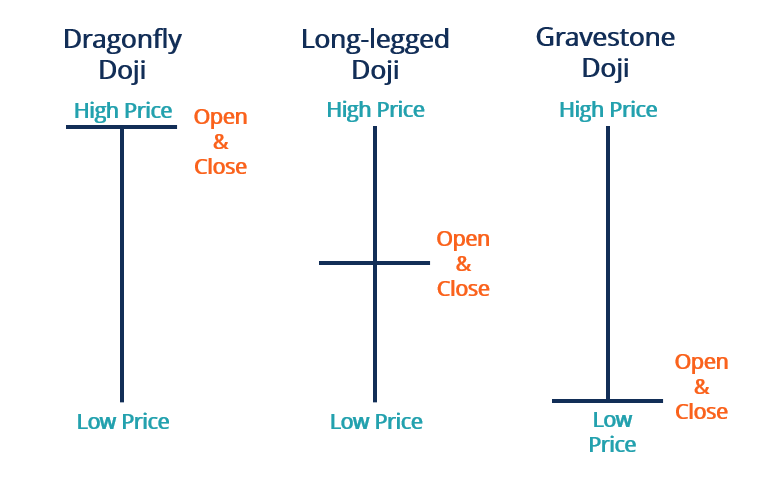
Different from the positive and negative candlesticks, a doji candlestick does not have a rectangular body. It is a rare type with equal open and close prices, which gives it a cross shape. Without other information, a doji candlestick is a neutral indicator, as it alone does not provide sufficient information to make trading decisions. There are three types of doji candlesticks – the gravestone doji, the long-legged doji, and the dragonfly doji.
A dragonfly doji is considered a signal of a potential reversal in the security price. It occurs when the open, close, and high prices of a security are virtually the same. Thus, a dragonfly doji is T-shaped without an upper tail, but only a long lower tail.
The long lower tail of a dragonfly doji indicates that large amounts of selling have flooded the market, which caused downward pressure on the security price during a certain period. However, at the end of that period, the close price is still able to stay at the level of the open price. It suggests that buyers in the market are able to absorb this much selling and pull back the price.
A dragonfly doji can be an indicator of a reversal in price. When the price of a security has shown a downward trend, it might signal an upcoming price increase. It is a bullish dragonfly in this case. If the candlestick right after the bullish dragonfly rises and closes at a higher price, the price reversal is confirmed, and trading decisions can be made.
Conversely, when the market has shown an upward trend before, a dragonfly doji might signal a price drop, known as a bearish dragonfly. The downward movement of the next candlestick will provide confirmation.
Traders can use a dragonfly doji to make trading decisions. They usually create orders right after the confirmation candlestick appears. A trader can long a stop loss below the low of a bullish dragonfly or short a stop loss above the high of a bearish dragonfly.
The dragonfly doji rarely occurs, but price reversal happens constantly. Thus, the dragonfly doji is not a highly reliable indicator of price reversals. Even with the confirmation candlestick, it is not guaranteed that the price will continue the trend. Typically, a dragonfly doji with a higher volume is more reliable than one with a lower volume. It also applies to the confirmation candlestick.
In addition to the reliability concern, another limitation of the doji pattern is that it cannot provide price targets. It is difficult to estimate the return of a trade that is made according to pure dragonfly doji analysis. Traders need to use other technical indicators or patterns to identify the proper time for an exit.
As mentioned above, the other two types of doji patterns are the gravestone doji and the long-legged doji. The gravestone doji is in the reversed shape of the dragonfly. The low, open, and close prices of a gravestone doji are at the same level. Same as the dragonfly, the gravestone doji also indicates potential price reversals and requires confirmation candlesticks.
The long-legged doji has long upper and lower tails, with great price fluctuations during a period. It indicates indecision with supply and demand around the market equilibrium. The pattern is not always reliable or significant.
Thank you for reading CFI’s guide on Dragonfly Doji Candlestick. To keep learning and advancing your career, the following resources will be helpful:


