Get Certified for
Capital Markets (CMSA®)
From equities and fixed income to derivatives, the CMSA certification bridges the gap from where you are now to where you want to be — a world-class capital markets analyst.
A technical analysis tool that signals an upward price momentum's reversal to bearish momentum
The Evening Star pattern is a type of reversal pattern of asset price charts. It usually appears at the top of an uptrend and is a bearish signal. Traders do not commonly see an Evening Star pattern, but it is a reliable indicator for technical analysis.
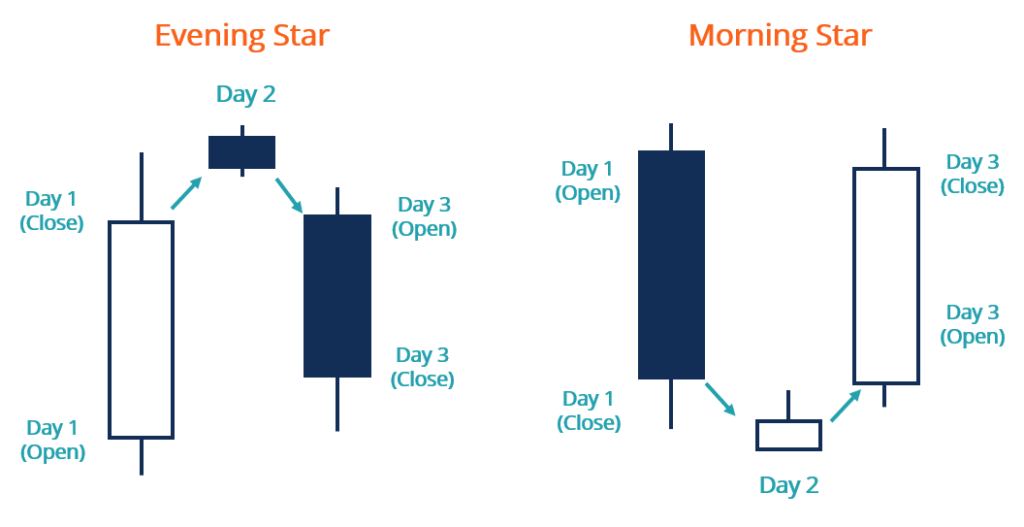
An Evening Star pattern can be observed in a candlestick chart of an asset price, consisting of three candles. The first one is a long-body candle, representing a large rise in price with the close price settling above the open price. This bullish candle reflects an upward momentum of the asset price.
The second candle is the “star” with a small body (either bullish or bearish) or without a body (neutral). The star feature indicates that the asset price closes at the level very close to the open price with balanced buying and selling orders. The star signals a slow-down in the previous bullish momentum. There should be a gap up from the first candle to the star in an ideal Evening Star pattern. It means that the open price increased rapidly from the preceding close price with very few or even no transactions happening in the meanwhile.
Typically with a gap down from the preceding star, the third candle is bearish, with the close price lower than the open price. The upward trend shown in the first candle has been reversed, and the price gain has been eliminated. This candle confirms the Evening Star pattern (ideally with a gap down) and gives a selling signal.
The characteristics of candle bodies are more essential than those of candle shadows. The shadow is the lines above and below a candle body and reveals the highest and lowest prices during a certain period. A longer shadow indicates a greater fluctuation of price, vice versa. While identifying an Evening Star pattern, analysts pay more attention to the open and close prices rather than the trading range of that day.
The Evening Star pattern is a useful tool for technical analysis, as it can predict investor sentiment and change in price momentum.
As discussed above, an Evening Star pattern consists of three candles, one for each day. On the first day, with a long bullish candle, the asset price moves upward with strong momentum. After a sudden increase in price reflected by a gap up, the momentum starts to weaken on the second day when the star appears.
However, the second day is still an indecision day between the bullish and bearish sentiment. If there is a gap down as the market opens on the third day, it is an indication that the momentum will be reversed, signaling traders to make a short decision. When the price closes much lower at the end of the third day, an Evening Star pattern is thus confirmed.
In contrast to the Evening Star pattern, a Morning Star pattern signals a trend reversal from bearish to bullish. The first candle of a Morning Star pattern is a long bearish candle, indicating a downward price momentum. The “morning star” is a short-body (either bullish or bearish) or Doji candle.
The third candle is a bullish one, which confirms the reversal and covers most of the first candle loss. Ideally, there is a gap down from the first candle to the morning star, a gap up from the morning star to the confirmation candle.
Besides the Evening Star and Morning Star, there are also other Star patterns. All the other Star patterns are reversal patterns that can help traders make buy or sell decisions. Although there’s always been a dispute regarding whether technical analysis can be a profitable investment tool, the Evening Star pattern is regarded as a reliable tool that predicts a bearish momentum.
CFI is the official provider of the global Capital Markets & Securities Analyst (CMSA)™ certification program, designed to help anyone become a world-class financial analyst. To keep advancing your career, the additional resources below will be useful:


