Get Certified for
Capital Markets (CMSA®)
From equities and fixed income to derivatives, the CMSA certification bridges the gap from where you are now to where you want to be — a world-class capital markets analyst.
A line drawn touching the support or resistance level on a price chart in technical analysis
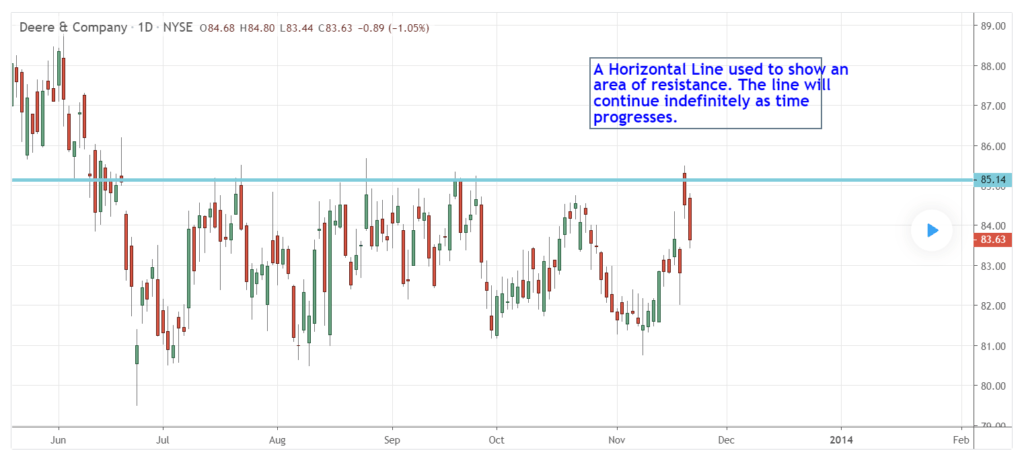
A horizontal line is a line drawn touching the support or resistance level on a price chart in technical analysis. Horizontal lines are commonly used to identify price breakouts and are deemed essential when analyzing trades.
In geometry analysis, a horizontal line is a straight line with a zero slope and perpendicular to the y-axis. It is also known as a constant function because all values on the line have the same y-values.
Horizontal lines are used in technical analysis to highlight price action. They are primarily used to draw special attention to support or resistance levels. In this case, the support level means the point where the stock price stops falling due to demand concentration or buying interest. On the other hand, a resistance level occurs when demand concentration triggers a downward trend.
Horizontal lines are drawn by connecting the same swing points. When a horizontal line is drawn by connecting it to similar swing highs, it is called a horizontal resistance line. Similarly, horizontal support lines are drawn by connecting swing lows.
Analysts and traders use horizontal lines to predetermine when the market is favorable. A stock price is considered range-bound when trend lines are within the support and horizontal resistance lines. However, a further price decline can be indicated by the movement below the support horizontal line.
Similarly, movements above the resistance horizontal line signal higher prices. After reaching a horizontal resistance line, an increase in price means traders need to watch for a break-out above the resistance line. If a data sample is used to draw a horizontal line to highlight a series of lows and highs, a data point moving below or above the horizontal line will point to a decline and rise in the values of the x-axis.
The vertical axis represents the price on a supply and demand curve, while the horizontal axis represents the quantity demanded. A perfectly horizontal line in a supply and demand curve shows that the quantity supplied or demanded demonstrates perfect elasticity or completely responds to price changes.
A change in the price above the market price results in quantity falling to zero. Perfect elasticity describes a market condition when consumers are unwilling to spend more than a specific price for goods or services.
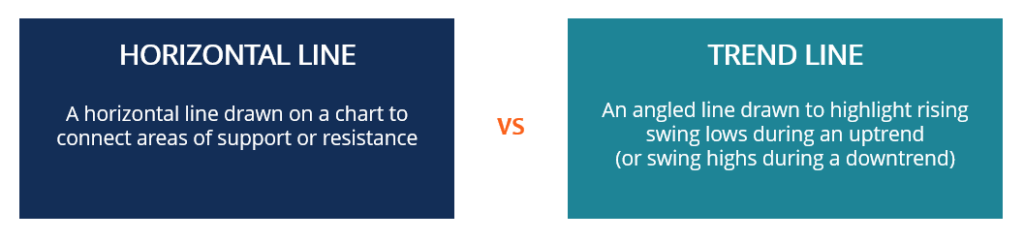
While both horizontal and trend lines can mean the same thing, there is a difference when trading them. The primary difference lies in the angle because their difference can also be found in trading shallow, regular, and steep lines. A horizontal line is particularly flat and horizontal, while a trend line is angled when drawn on a chart.
Trend lines may also be in different forms, based on their angles. For example, the steep trend line is angled more than 40 degrees, and the price movement exhibits a lot of momentum. A regular trend line is angled between 10 degrees and 40 degrees, and the price movement is well balanced and weaker. The shallow trend line is angled between 0 and 10 degrees, and the price movement is generally weak.
A horizontal line is subjectively drawn by traders at different prices. Stock prices may be subjected to opposing pressure when a horizontal line is drawn at highly important levels. It is therefore somewhat arbitrary and may not induce strong trading activity until a decisive move on prices occurs well below or above the horizontal line.
CFI is the official provider of the global Capital Markets & Securities Analyst (CMSA)™ certification program, designed to help anyone become a world-class financial analyst. To keep advancing your career, the additional resources below will be useful:


