Get Certified for
Capital Markets (CMSA®)
From equities and fixed income to derivatives, the CMSA certification bridges the gap from where you are now to where you want to be — a world-class capital markets analyst.
A market theory that postulates that the investment performance of the S&P 500 in the month of January is representative of the predicted performance of the entire year
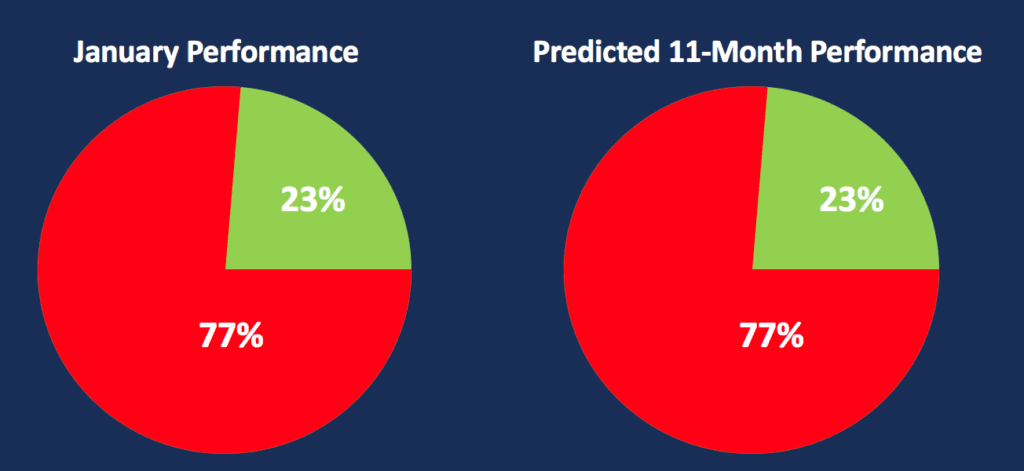
The January Barometer is the idea that the investment performance of the S&P 500 in the month of January is representative of the predicted performance of the entire year. For example, if the month of January yields positive momentum, it is said that the remainder of the year will rise as well. The opposite versa is also true. If the market performs poorly in January, it is said that the remainder of the year will do the same.
The concept of the January Barometer stemmed from a 1967 novel called “Stock Trader’s Almanac” by Yale Hirsch. It continues to be present in many people’s trading strategies.
Traders who believe in the theory may utilize the results to forecast and time the market. Particularly, as an indicator, they may only invest in the market during times that January is up and avoid it when the month’s returns are down. It is most often connected to U.S. equities, particularly focusing on the S&P 500.
Such a belief stems from the correlation found in data the S&P 500 predicted and actual returns between 1966 to 2001. In fact, dating back to 1928, the S&P 500 was tested 91 times to determine whether there was a correlation between their annualized and respective January months.
It appeared that on those 91 occasions, the market indeed ended the year in a similar direction as the month of January 63 times. However, it is important to be aware that the phenomenon may be coincidental, as positive returns also occurred 75% of the time within the U.S. equity markets. Thus, the strategy may not necessarily improve one’s market timing.
In 2017, the S&P 500 gained 2% in the month of January. Following afterward, the remaining months generated an annualized return of 19%, resulting in an upwards trend.
There are two major problems with using the January Barometer:
Although the success rate is fairly high, it is important for investors to understand that using the January Barometer as an indicator should be taken with a grain of salt, as opposed to a trading principle. It is best used to gain insight into the overall market’s health. By doing so, one can maintain a bullish perspective and gain confidence throughout the trading year when January yields positive momentum.
Mark Hulbert, the editor of the Hulbert Financial Digest, believes the January Barometer is ineffective. He states that the stock market rises two-thirds of the time, regardless of January’s performance, which ultimately makes the theory null.
Hulbert also disagrees with the point that if the market falls in January, the remaining 11 months should also fall. Hulbert looked at the returns of the Dow Jones Industrial Average (DJIA) from 1897 through 2008. He found that when the Dow fell in January, its average monthly return for the remaining months was 0.25%.
Rather, it’s been mentioned that market performance in December is a better predictor of the subsequent 11 months as opposed to January, while November is the third most accurate predictor. The three months with no predictive ability at all are February, August, and September.
However, it is best to remember that the January Barometer is most effective with the S&P 500, not the DJIA.
CFI is the official provider of the Capital Markets & Securities Analyst (CMSA)® certification program, designed to transform anyone into a world-class financial analyst.
To keep learning and developing your knowledge of financial analysis, we highly recommend the additional resources below:


