Get Certified for
Capital Markets (CMSA®)
From equities and fixed income to derivatives, the CMSA certification bridges the gap from where you are now to where you want to be — a world-class capital markets analyst.
When a security experiences a large movement to the upside or downside, followed by consolidation period, before subsequently moving in the same direction
A pennant pattern, referred to technical analysis, is a continuation pattern that is seen when a security experiences a large movement to the upside or downside, followed by a consolidation period, before subsequently moving in the same direction.
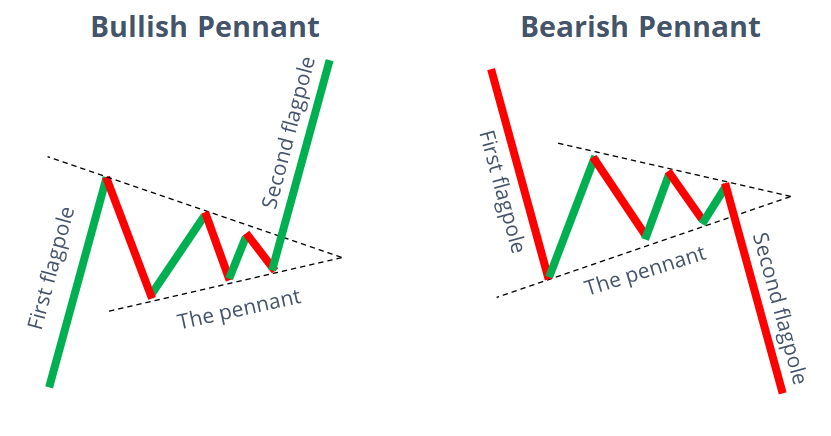
When looking at a pennant pattern, one will identify three distinct phases:
The first flagpole sets up the pennant pattern. The flagpole is an initial strong movement to the upside or downside.
The pennant pattern, which is the consolidation period between two converging trend lines, forms the shape of a pennant.
The second flagpole is a breakout of the pennant pattern in the same direction as the first flagpole.
The volume at each stage is also important to the success of a pennant pattern. The first flagpole must be met with large volume, followed by weakening volume in the formation of the pennant, ending with large volume during the second flagpole.
A pennant pattern can be bullish or bearish depending on the direction of the first flagpole, shown below.
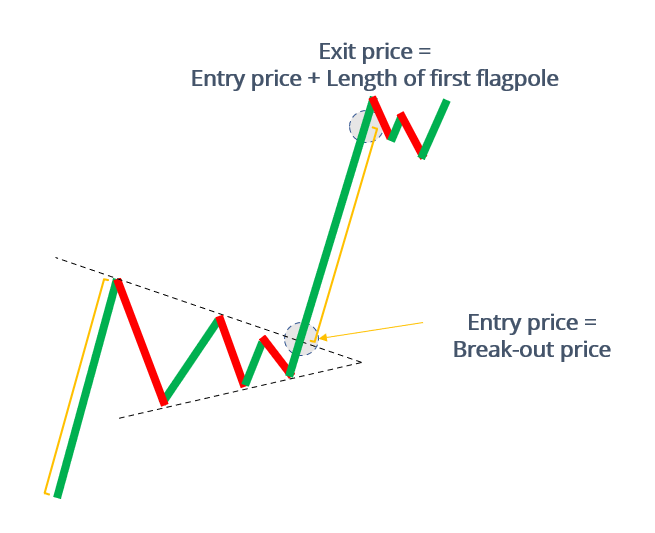
Traders will typically set a limit buy order at the upper trendline. On a breakout of the upper trendline, traders will first look for above-average volume to help confirm a pennant pattern breakout.
The price target sell order will then be set at the initial flagpole’s height plus the break-out price. In terms of risk management, a stop loss would generally be placed just below the lower trendline.
For example, assume the first flagpole goes from a price of $10 to $20, forms a pennant through a consolidation around $16, and breaks out from the pennant at $18. The entry price would be $18, and the ideal exit price would be $28 ($18 + $10).
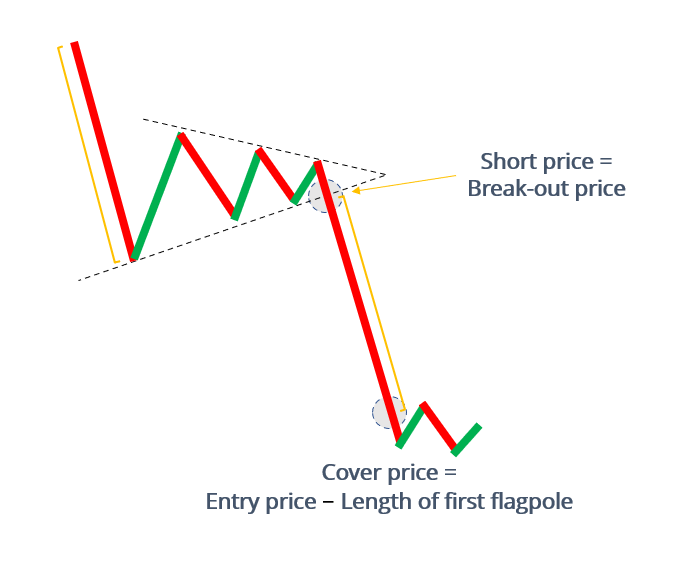
Traders will typically set a limit short order at the lower trendline. On a breakout of the lower trendline, traders will first look for above-average volume to help confirm a pennant pattern breakout.
The cover price will then be set at the initial flagpole’s height minus the breakout price. In terms of risk management, a stop loss would generally be placed just above the upper trendline.
For example, assume the first flagpole goes from a price of $50 to $40, forms a pennant through a consolidation around $44, and breaks out from the pennant at $42. The short price would be $42, and the ideal cover price would be $32 ($42 – $10).
A pennant pattern is classified as a short-term pattern that generally forms over a period of days or weeks. It is not uncommon for traders to trade on pennant patterns that appear in longer time frames.
Thank you for reading CFI’s guide to Pennant Patterns. To keep learning and developing your knowledge of financial analysis, we highly recommend the additional resources below:


