Get Certified for Financial Planning & Analysis
Gain in-demand industry knowledge and hands-on practice that will help you stand out from the competition and become a world-class financial analyst.
Calculating percentages in Microsoft Excel is a crucial skill for all financial professionals
As part of any financial analysis, practitioners will normally calculate the change in various metrics. There are two types of change calculations: 1) absolute, or 2) relative (i.e., percentage).
An example of an absolute change is the following: a company earned $14 million in revenue this year and $10 million in revenue in the previous year. The absolute change in revenue is an increase of $4 million ($14 million – $10 million). We call it absolute since the result is a “standalone” number and not relative to anything.
The problem with absolute changes is that they are difficult to compare over time or against other companies (since other companies might be much larger or much smaller). Therefore, the relative change can be more meaningful. The most common relative change is percentage change. It’s called relative change because the calculation is relative to a “starting” value.
Calculating the percentage change between two variables is one of the most common calculations in all of finance. Fortunately, it’s also one of the easiest.
The basic percentage formula can be calculated in two different ways in Excel.
Percentage Formula Method One:
Percentage Formula Method Two:
Method One and Method Two are mathematically the same.
Although Method Two is the method that is normally taught early on in a learner’s educational path (e.g., grade school), you are more likely to see Method One in financial analysis and modeling.
Sometimes you will see the above calculations multiplied by 100. However, this converts the percentage to a real number. In general, you don’t typically want the percentage change converted to a real number when building financial models or analyzing financial statements in Excel. Instead of multiplying by 100, we recommend using the percentage formatting feature in Excel.
Below, we show several ways to calculate percentage in Excel. Calculating percentages in Excel can be done whether the data is organized down multiple rows or across columns.

Source: CFI’s 3-Statement Modeling Course.


Source: CFI’s downloadable Beta Template.
Regardless of the method used, the calculation should be displayed using the percentage number format in Excel:

Alternatively, you can use the Excel shortcut Ctrl Shift 5 to quickly change a cell to the percentage format.

Click the button below to download our free Percentage Change Calculator!
Calculating percentages can be used in many areas of finance. For example, percentage changes are used to determine an investment’s return over a specific period.
For example, you buy a stock worth $95 today. A week later, the stock has increased in value to $105. Using either of the previous formulas, we can say the stock price increased by approximately 10.5% over that week (105/95 – 1 = 10.5%; alternatively (105 – 95)/95 = 10.5%).
The percent change in a stock’s price is also used when calculating beta.
Economists use the percentage formula to calculate inflation rates or growth (or decline) in payroll numbers.
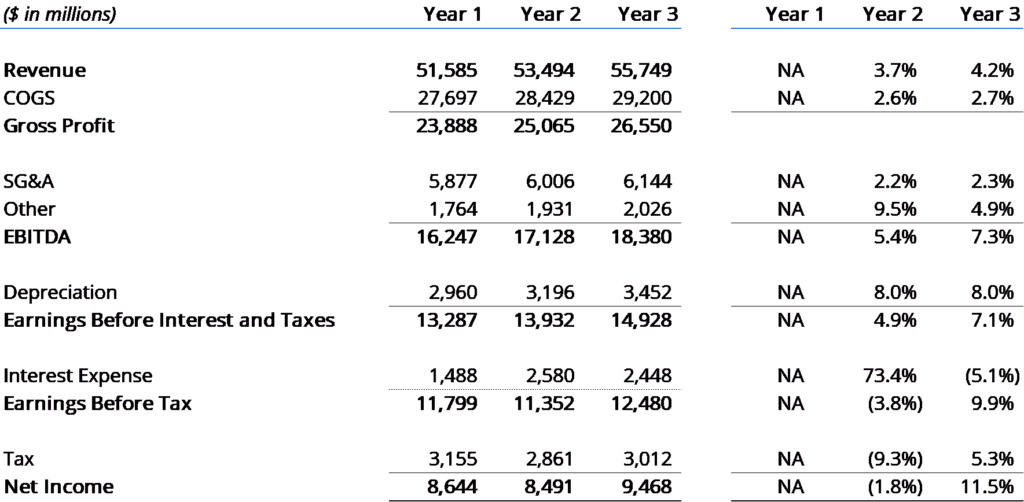
Percentage change is also commonly used when analyzing financial statements. Changes in revenues and costs are calculated to see trends over time. Since percentages are relative changes, they are more useful when analyzing companies over time.
A related percentage change calculation is the compound annual growth rate (CAGR) calculation. The CAGR effectively calculates the annual percentage change between two values but over several periods.
The formula for CAGR is: (Ending Value/Beginning Value) ^ (1/No. of Periods) – 1.
Simply put, the CAGR “smooths out” the percentage change and assumes this rate is constant over the applicable time periods. The CAGR will equal the traditional percentage calculation if there is only one period in the computation.
The percentage change formula is New Value/Old Value – 1.
Returning to our earlier example: a company generates $14 million in revenue in the most recent year, compared to $10 million in the previous year. The percentage change is a 40% increase (14/10 – 1 = 40%).
The percentage decrease formula is the exact same as the percentage increase formula.
In this case, let’s assume the company generates only $9 million in revenue in the most recent year, compared to $10 million in the previous year. The percentage change is a 10% decrease (9/10 – 1 = -10%).
However, if some values are negative numbers, then the percentage change formula may return nonsensical results.
For example, assume the new value is 4, while the old value is -2. Mathematically, the percentage change is a decrease of 300% (4/-2 – 1 = -300%). However, this result doesn’t make intuitive sense.
While there is no widely accepted formula to deal with this inconsistency, we can often take the absolute value of the old value when calculating the percentage change. In this case, we would convert the negative 2 to a positive 2. Our calculation will then yield an increase of 100% (4/2 – 1 = 100%).
Excel can easily convert a negative value to a positive value using the ABS function. Assuming the new value of 4 is in cell A1 and the old value of -2 is in cell A2, then our Excel formula would look like this: =A1/ABS(A2)-1.
Therefore, our new formula is New Value/ABS(Old Value) – 1; alternatively, (New Value – Old Value)/ABS(Old Value).
Of course, if the old value is zero, then the percentage change cannot be calculated. Therefore, an Excel user may need to use IFERROR to return a desired output if the old value is zero. The “error” response in IFERROR can be customized to the user’s specifications.
For example, let’s assume there is no revenue in the previous year but $10 million in revenue in the current year. Since we cannot divide by zero, there is no mathematically possible calculation that returns a reasonable value. However, we can use the following formula in Excel, assuming the input numbers are in millions of dollars.
The following calculation outputs 100%: =IFERROR (10/0 – 1, 1), also assuming the calculated cell is formatted as a percentage.
If the new value is also zero, then the Excel formula might be =IFERROR(0/0 – 1, 0), which would return 0%.
In some circumstances, a user might need to create an Excel formula that captures both scenarios (both the new and old values may be zero). Something like the following formula would take care of a scenario under which the numerator can be either a number or zero, and the denominator can be a zero: =IF(New Value<>0, IFERROR(New Value/Old Value – 1, 1), IFERROR(New Value/Old Value -1, 0)).
Percent changes are often used when analyzing and projecting financial statements. For example, we can use the percentage change formula to compute the historical growth rate in revenue. From there, we, as analysts, make a judgment call about future revenue growth.
Once we determine the appropriate future revenue growth rate, we can input that as a percentage. We can then calculate the future revenue using the formula: Projected Value = Previous Value * (1 + the forecast percentage growth rate).
Let’s look at an example: In the most recent year, a company generated $9 million in revenue. An analyst thinks the company’s revenue will grow by 4% in the next year. The projected revenue is $9.36 million (9 million * (1 + 4%)).
Conversely, maybe the analyst thinks that revenue will actually decline by 7%. Therefore, the projected revenue is $8.37 million (9 million * (1 + -7%)). Note that the expression 1 + -7% evaluates to 1 – 7%, or 93%.
So you can see that the same formula works regardless of whether the percentage change is forecast to be positive or negative.
Depending on what metric is being calculated a positive percentage change can be interpreted favorably. As an example, assume a company generated $120 million in revenue in the latest period and $115 million in revenue in the prior period. In this case revenue increased by approximately 4.3%. Revenue increases are considered a favorable outcome.
However, if the same company’s cost of goods sold (COGS) increased to $70 million in the latest period compared to $60 million in the previous period. This indicates an approximate 16.7% increase. In this case, the percentage increase would be considered an unfavorable outcome.
The same rationale applies to percentage decreases. If revenue instead declined by 4.3%, this would be an unfavorable outcome. Conversely, if COGS decreased by 16.7%, this would normally be a very favorable outcome.
Therefore, context is crucial when interpreting percentage changes.
Connect what you just learned to a clear career path with CFI’s role‑based courses and certification programs.
Thank you for reading CFI’s guide on Calculating Percentage Change in Excel. To keep learning and developing your knowledge base, please explore the additional relevant resources below:


