Get Certified for Financial Modeling (FMVA)®
Gain in-demand industry knowledge and hands-on practice that will help you stand out from the competition and become a world-class financial analyst.
The top 10 Excel functions you need to know
Excel is the primary tool finance professionals use to value companies, model cash flows, build loan schedules, and analyze investments. This guide walks through the most important Excel finance formulas like XNPV, XIRR, PMT, EFFECT, and DB so you can apply them directly in real-world financial models.
Each function includes a plain‑English explanation, syntax, and a simple finance example (DCF valuation, loan amortization, bond pricing, or depreciation) to help you see where it fits in your day‑to‑day work.
Excel finance formulas are the backbone of valuation, investment analysis, and financial modeling. This guide walks through the top 10 Excel functions every finance professional should know with real finance examples.
Each function is shown with its syntax and a practical use case, from DCF valuations and loan schedules to bond yields and stock beta, so you can apply these formulas directly in your own models.
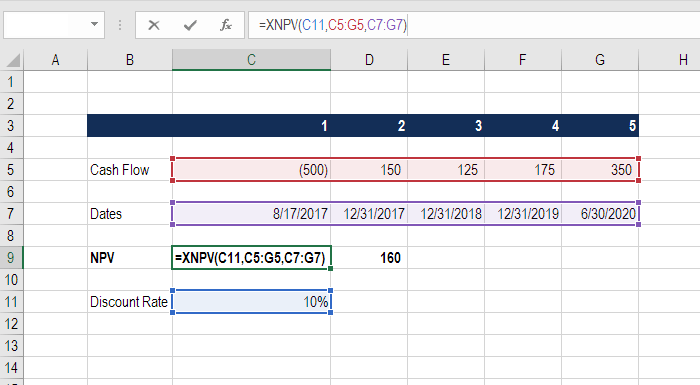
Formula: =XNPV(discount_rate, cash_flows, dates)
The number one formula in Excel for finance professionals has to be XNPV. Any valuation analysis aimed at determining what a company is worth will need to determine the Net Present Value (NPV) of a series of cash flows.
Unlike the regular NPV function in Excel, XNPV takes into account specific dates for cash flows and is, therefore, much more useful and precise.
To learn more, check our free Excel Crash course.
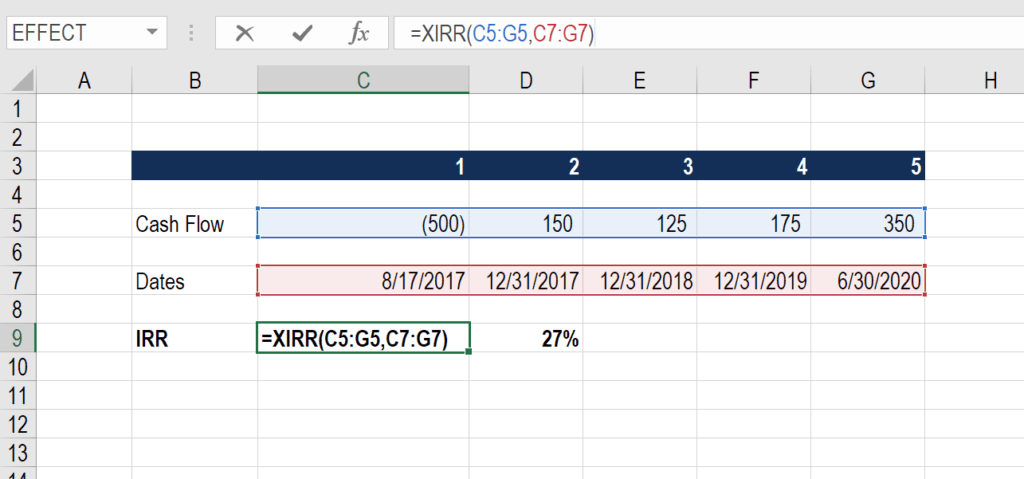
Formula: =XIRR(cash flows, dates)
Closely related to XNPV, another important function is XIRR, which determines the internal rate of return for a series of cash flows, given specific dates.
XIRR should always be used over the regular IRR formula, as the time periods between cash flows are very unlikely to all be exactly the same.
To learn more, see our guide comparing XIRR vs IRR in Excel.
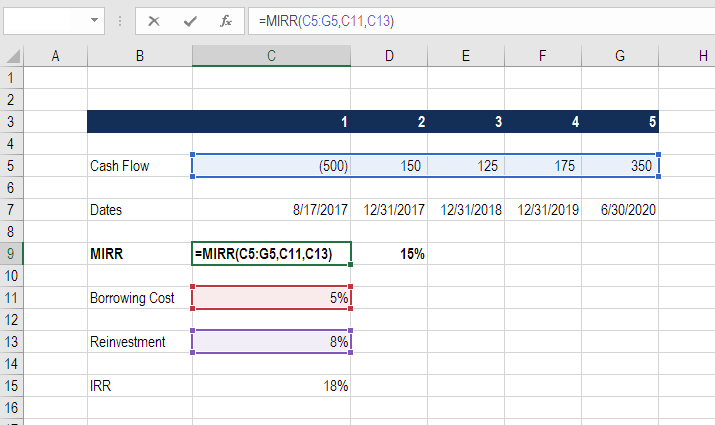
Formula: =MIRR(cash flows, cost of borrowing, reinvestment rate)
Here is another variation of the internal rate of return that’s very important for finance professionals. The M stands for Modified, and this formula is particularly useful if the cash from one investment is invested in a different investment.
For example, imagine if the cash flow from a private business is then invested in government bonds.
If the business is high returning and produces an 18% IRR, but the cash along the way is reinvested in a bond at only 8%, the combined IRR will be much lower than 18% (it will be 15%, as shown in the example below).
Below is an Example of MIRR in action.
To learn more, check our free Excel Crash course.
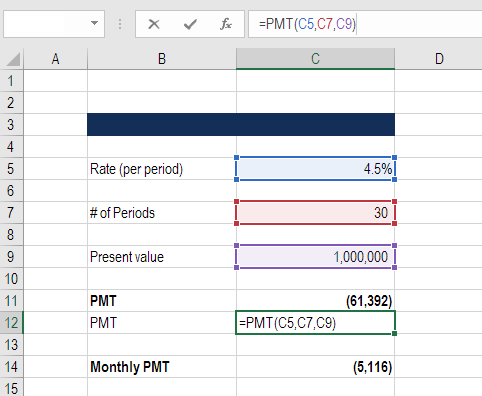
Formula: =PMT(rate, number of periods, present value)
This is a very common function in Excel for finance professionals working with real estate financial modeling. The formula is most easily thought of as a mortgage payment calculator.
Given an interest rate, and a number of time periods (years, months, etc.) and the total value of the loan (e.g., mortgage) you can easily figure out how much the payments will be.
Remember this produces the total payment, which includes both principal and interest.
See an example below that shows what the annual and monthly payments will be for a $1 million mortgage with a 30-year term and a 4.5% interest rate.
To learn more, see our real estate financial modeling course!
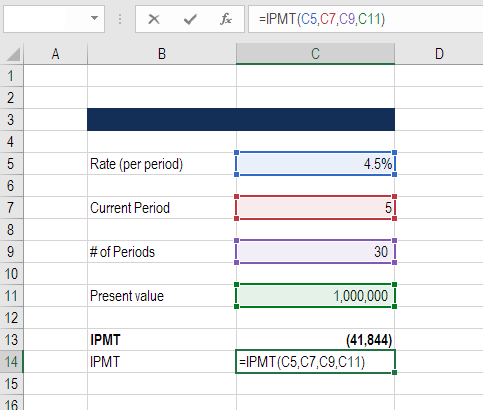
Formula: = IPMT(rate, current period #, total # of periods, present value)
IPMT calculates the interest portion of a fixed debt payment. This Excel function works very well in conjunction with the PMT function above. By separating out the interest payments in each period, we can then arrive at the principal payments in each period by taking the difference of PMT and IMPT.
In the example below, we can see that the interest payment in year 5 is $41,844 on a 30-year loan with a 4.5% interest rate.
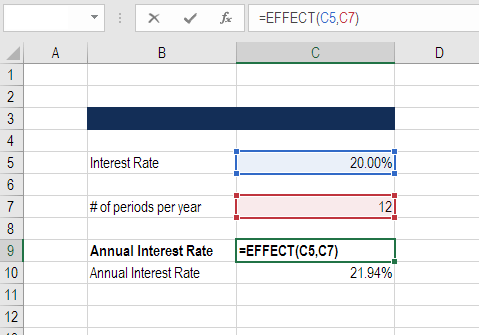
Formula: =EFFECT(interest rate, # of periods per year)
This finance function in Excel returns the effective annual interest rate for non-annual compounding. This is a very important function in Excel for finance professionals, particularly those involved with lending or borrowing.
For example, a 20.0% annual interest rate (APR) that compounds monthly is actually a 21.94% effective annual interest rate.
See a detailed example of this Excel function below.
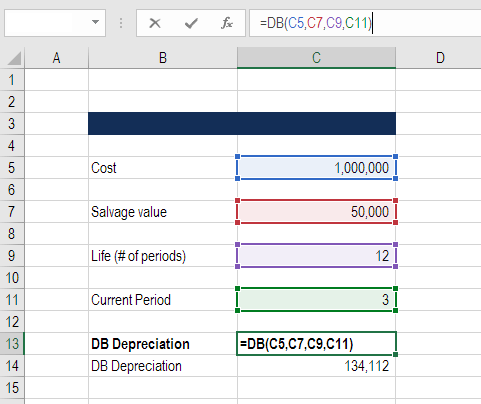
Formula: =DB(cost, salvage value, life/# of periods, current period)
This is a great Excel function for accountants and finance professionals. If you want to avoid building a large Declining Balance (DB) depreciation schedule, Excel can calculate your depreciation expense in each period with this formula.
Below is an example of how to use this formula to determine DB depreciation.
In financial modeling, analysts typically build out a depreciation schedule manually. To learn more, check out our series of financial modeling courses.
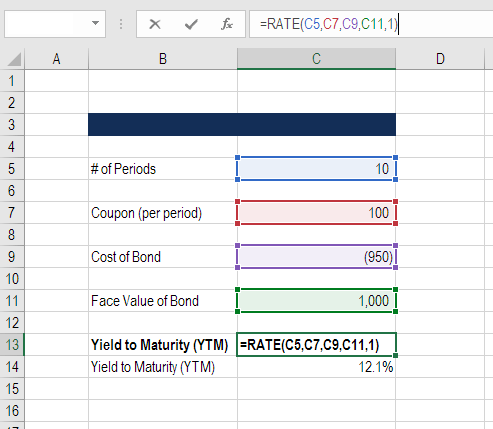
Formula: =RATE(# of periods, coupon payment per period, price of bond, face value of bond, type)
The RATE function can be used to calculate the Yield to Maturity for a security. This is useful when determining the average annual rate of return that is earned from buying a bond.
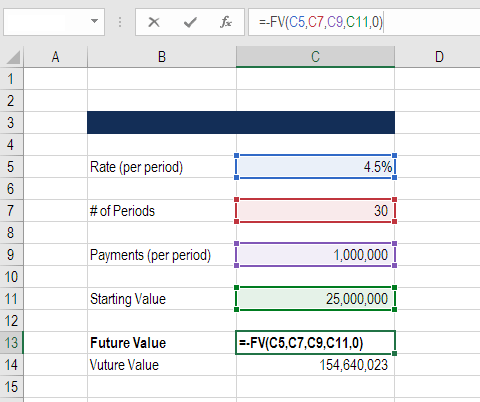
Formula: =FV(rate, # of periods, payments, starting value, type)
This function is great if you want to know how much money you will have in the future, given a starting balance, regular payments, and a compounding interest rate.
In the example below, you will see what happens to $25 million if it’s grown at 4.5% annually for 30 years and receives $1 million per year in additions to the total balance. The result is $154.6 million.
To learn more, check out our Advanced Excel Formulas Course.
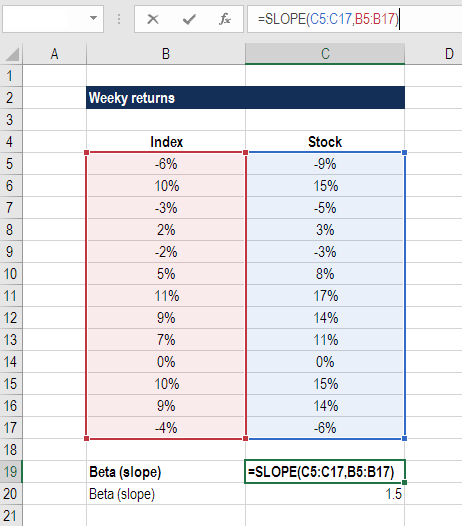
Formula: =SLOPE(dependent variable, independent variable)
Finance professionals often have to calculate the Beta (volatility) of a stock when performing valuation analysis and financial modeling. While you can grab a stock’s Beta from Bloomberg or from CapIQ, it’s often the best practice to build the analysis yourself in Excel.
The slope function in Excel allows you to easily calculate Beta, given the weekly returns for a stock and the index you wish to compare it to.
The example below shows exactly how to calculate beta in Excel for financial analysis.
To learn more, check out our valuation courses online.
Connect what you just learned to a clear career path with CFI’s role‑based courses and certification programs.
Click the button below to download our free Excel for Finance Functions template!
CFI now offers the Business Essentials Bundle with courses on Microsoft Excel, Word, and PowerPoint, business communication, data visualization, and an understanding of corporate strategy. To keep learning, we suggest these resources:


