Excel Solver
An optimization tool used to determine the desired outcome by changing a model's assumptions
What is Excel Solver?
Excel Solver[1] is an optimization tool that can be used to determine how the desired outcome can be achieved by changing the assumptions in a model. It is a type of what-if analysis and is particularly useful when trying to determine the “best” outcome, given a set of more than two assumptions. Learn with video instruction in CFI’s Advanced Excel Course.
How to Use Excel Solver – Example
The best example of how to use Excel solver is by graphing a situation where there is a non-linear relationship between, for example, the number of salespeople in a company and the profit that they generate.
There is a diminishing return on salespeople, so we want to figure out what the optimal number of people to hire is. Put another way, we want to figure out how many salespeople we should hire to get the maximum amount of profit.
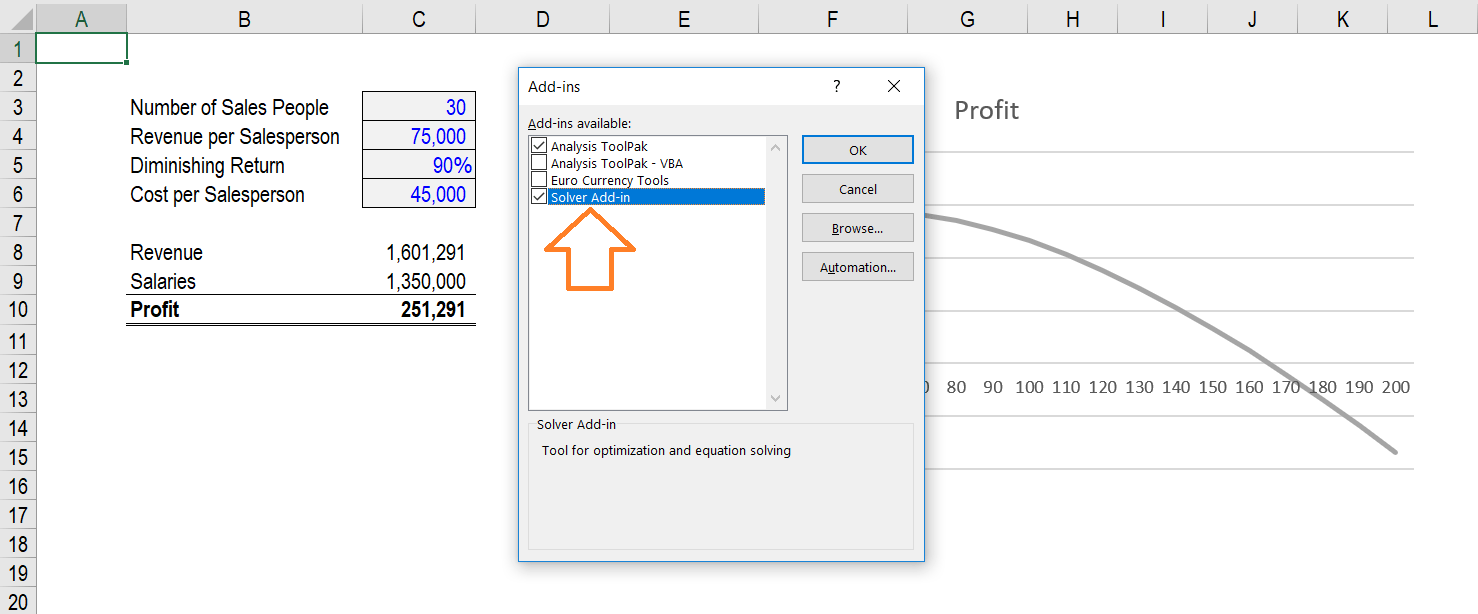
Step 1: Ensure the Solver Add-In is Installed
The first step is to make sure you have Solver installed in your Excel file. To do this, go to File -> Options -> Add-Ins -> Manage Excel Add-Ins[2]. When the dialogue box appears, make sure the box is ticked, as shown below.
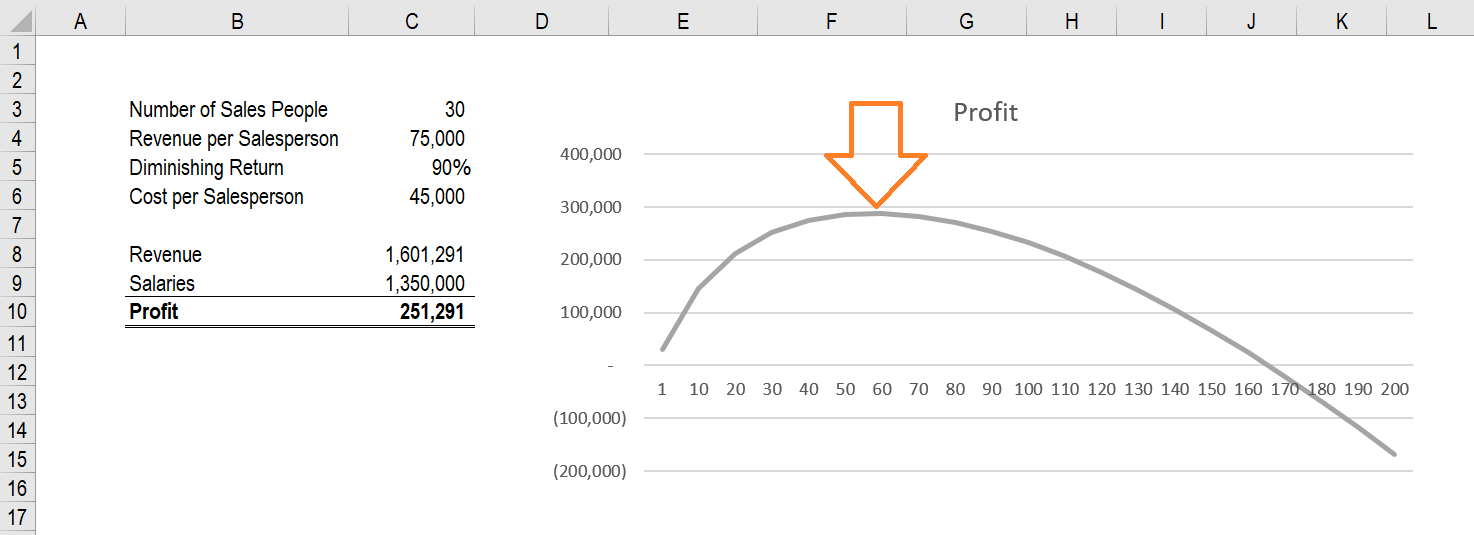
Step 2: Build a Model
Here, we’ve created an example where there is a non-linear relationship between the number of salespeople in a company and its profit. This is because as more salespeople are added, the less effective overall they become. Imagine a very niche market that only has a certain number of customers.
As you add more salespeople initially, you generate a lot more revenue, but at some point, additional salespeople run out of new people to prospect and they become dead weight for the company. The point of this model is to show an example that can’t easily be calculated using Goal Seek or some other solution.
Learn with video instruction in CFI’s Advanced Excel Course.
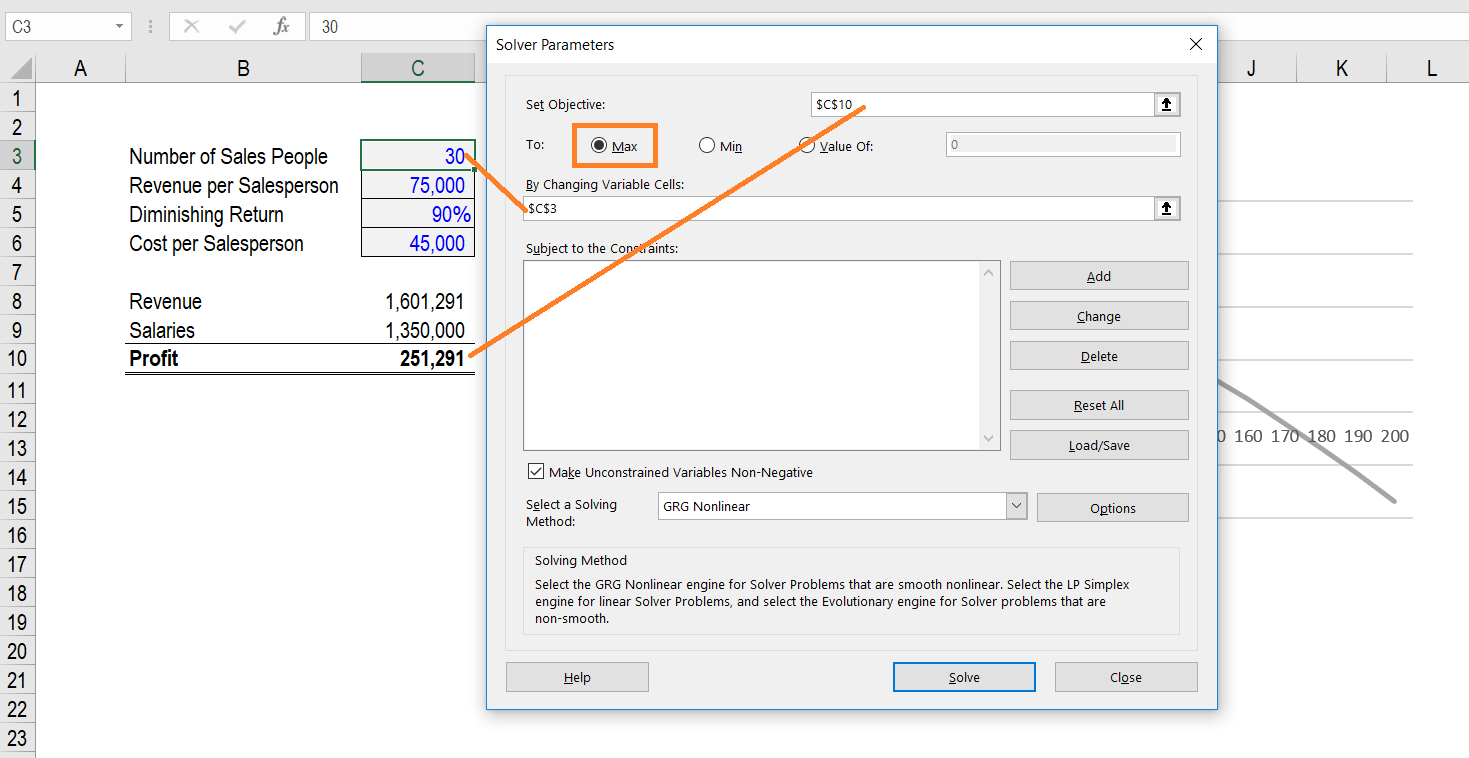
Step 3: Use the Ribbon to Launch Excel Solver
The Excel Solver function is located on the Data Ribbon and the keyboard shortcut on Windows is Alt, A, Y21. Once the dialog box appears you will notice several options you can work with.
- Set the “Objective” cell. In our case, this is Profit.
- Set it “To” something (Max, Min, or a specific value). In our case, we want the Max Profit.
- Select the Cell(s) you want to change in order to find the solution. In our case, we want to select the number of salespeople cell.
- Add constraints. If you want to set a constraint (e.g., a cell must be > or < some number), you can add this in. In our case, there are no constraints.
- Click “Solve.”
- Decide if you want to keep the solution in the cells or restore the original values.
Graph Solution
In this example, we’ve also shown how you could use a graph to get the solution, and this really helps illustrate the relationship between the number of salespeople and the profit of the business. Using both Excel Solver and the graph together really instills confidence in our analysis.

Download the Excel Solver Template
Download the Excel file used in this example to play around with it. Try building your own from scratch too!
Solver vs Goal Seek
Both tools are extremely useful when performing financial modeling and analysis in Excel. The main difference is:
- Goal Seek only allows you to change one variable, while Solver allows you to change many variables at once.
- Solver allows you to find a Max or Min solution (optimization) while Goal Seek forces you to choose a specific outcome (not necessarily the optimal solution).
Download CFI’s Excel Shortcuts Cheat Sheet
Use the form below to download CFI’s free Excel Shortcuts Cheat Sheet for Macs and PCs.
Additional Resources
Thank you for reading CFI’s guide to optimization problems in Excel and using Excel Solver. To continue learning and advancing your career as a world-class financial analyst, these additional CFI resources will be very helpful:
- Data Validation
- Excel Modeling Best Practices
- Excel Shortcut Keys
- VBA Variables, Data Types, and Dim
- See all Excel resources
Article Sources
Excel Tutorial
To master the art of Excel, check out CFI’s Excel Crash Course, which teaches you how to become an Excel power user. Learn the most important formulas, functions, and shortcuts to become confident in your financial analysis.

Launch CFI’s Excel Crash Course now to take your career to the next level and move up the ladder!


