Over 2 million + professionals use CFI to learn accounting, financial analysis, modeling and more. Unlock the essentials of corporate finance with our free resources and get an exclusive sneak peek at the first chapter of each course.
Start Free
What is the Goal Seek Excel Function?
The Goal Seek[1] Excel function (often referred to as What-if-Analysis) is a method of solving for a desired output by changing an assumption that drives it. The function essentially uses a trial and error approach to back-solving the problem by plugging in guesses until it arrives at the answer.
For example, if the formula for revenue is equal to the number of units sold multiplied by the selling price, Goal Seek can determine how many units have to be sold to reach $1 million of revenue, if the selling price is known. The function is extremely useful for performing sensitivity analysis in financial modeling.
Simple Goal Seek Example
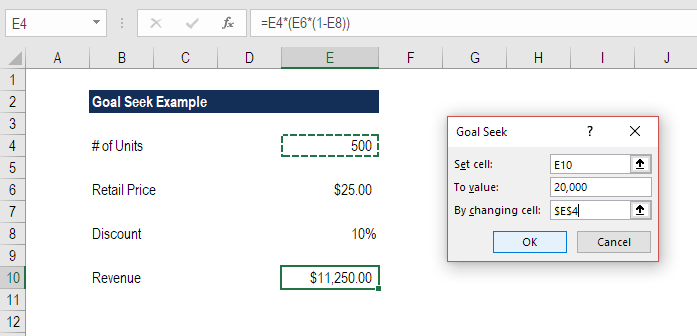
Let’s look at a simple exercise first, to see how Goal Seek works. Suppose we have a very basic model that takes the number of units sold, the retail price, and a discount to calculate total net revenue.
The current model contains the following information:
# of units: 500
Retail price: $25.00
Selling discount: 10%
Revenue: $11,250
Now suppose we want to find out how many units have to be sold to reach $20,000 of revenue. See the screenshot below and follow the steps listed to use the Goal Seek Excel tool.
Steps to Use Goal Seek Excel:
Put the cursor on the cell that contains the output you want to change (revenue)
On the Data ribbon, select What-if-analysis, then select Goal Seek (keyboard shortcut is Alt, A, W, G)
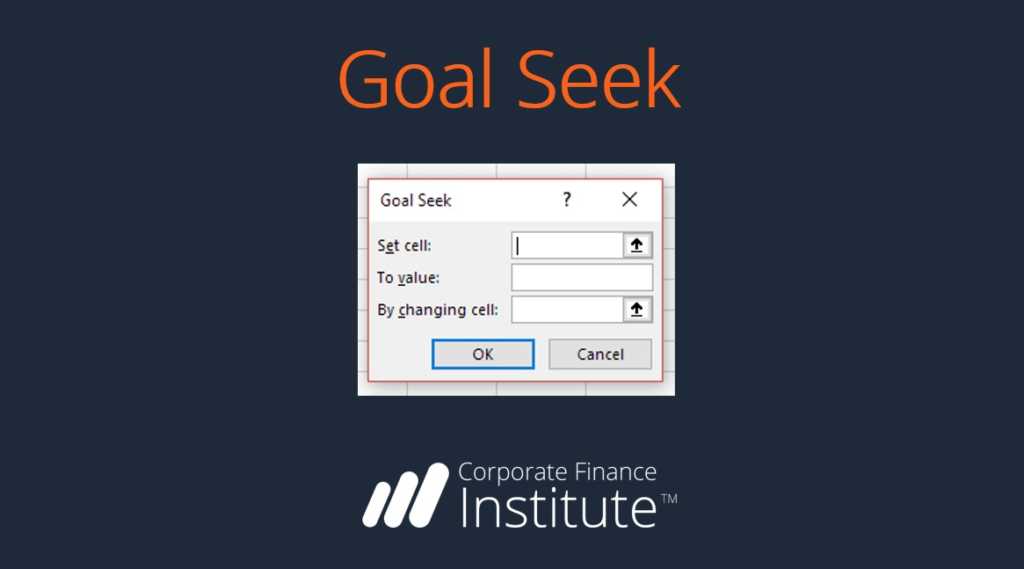
When the dialog box appears (as shown below) make “Set cell” equal to the revenue cell (E10)
Set “To value” equal to the output you want to achieve (type the number in)
Set “By changing cell” equal to the assumption you want to solve for (# of units, or cell E4)
Press OK
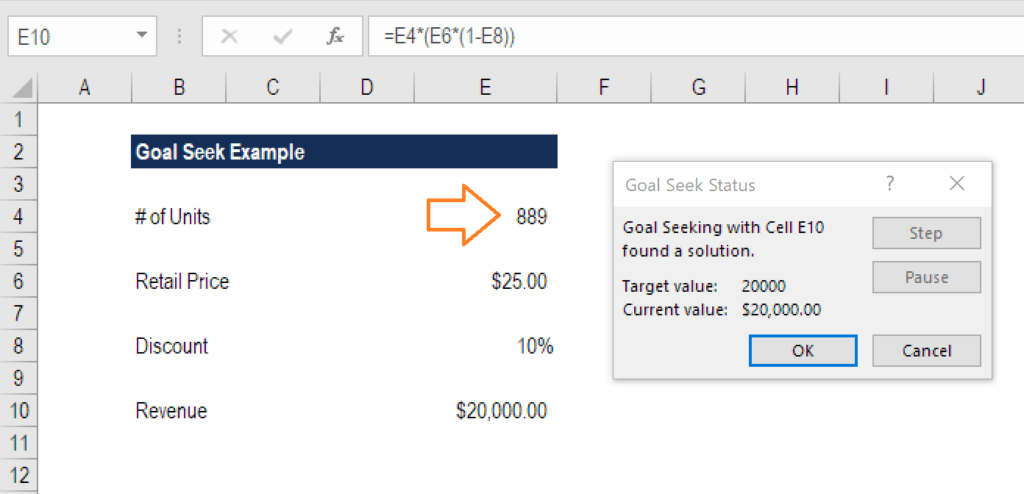
Below is the output from the analysis. We can see that to achieve $20,000 of revenue, 889 units need to be sold. Notice that the solution is displayed directly in cell (E4), not in the dialogue box.
Press OK to keep the solution running in the model (cell E4 will permanently change to 889 units), or press Cancel to return to the original assumption (500 units).
A Video Example of the Goal Seek Excel Function
Here is a more advanced video demonstration of how to use the Goal Seek Excel function. This video clip is an excerpt from CFI’s Free Excel Crash Course as recorded by Tim Vipond, CEO of the Corporate Finance Institute®.
Video Transcript
Suppose you want to find the NPV equal to $500 million based on a certain discount rate. In order to do that, what I’m going to do is use the GOAL SEEK Excel function. I’m going to press Alt, A, W, and G for GOAL SEEK. What I want to do is set this value, the value of the NPV equal to $500 million, by changing the discount rate, and press OK. I can see here that the discount rate is 25 percent to get to a $500 million NPV. I’m going to press Cancel and type that answer in this cell here. Now what I’ve done is just essentially taken a note of what the discount rate has to be to get a $500 million NPV.
All right, let’s do another example. Suppose that I want 2020 net income to be $10 million, and I want to get there by changing the 2020 revenue. How much revenue do we need in 2020 to get $10 million of net income? I’m going to press Alt, A, W, and G for GOAL SEEK, so what I want to do is change this number here, this net income in 2020 to be $10 million by changing this target case revenue as the one that’s currently running in our model, so I need to change that cell, and I see that the target revenue is $122.7 million. Press Cancel and type here 122700, so that’s the revenue that’s required to get there.
This is how I can summarize an important information point done here using GOAL SEEK.
Just a little bit of housekeeping here, I’m going to put a border Alt, H, B, P to put a border across the top there, and here I’m going to say goal seek analysis, in brackets, What-if, and I’m just going to put a border over this section here, Alt HBP, and I can select these cells here, press Shift + Spacebar and Alt, D,G, G to group those. Now everything rolls back up to a nicely organized spreadsheet.
Additional Resources
Thank you for reading CFI’s explanation of the Goal Seek Excel function. To continue learning and advancing your career, these additional CFI resources will be helpful:
To master the art of Excel, check out CFI’s Excel Crash Course, which teaches you how to become an Excel power user. Learn the most important formulas, functions, and shortcuts to become confident in your financial analysis.
Take your learning and productivity to the next level with our Premium Templates.
Upgrading to a paid membership gives you access to our extensive collection of plug-and-play Templates designed to power your performance—as well as CFI's full course catalog and accredited Certification Programs.
Gain unlimited access to more than 250 productivity Templates, CFI's full course catalog and accredited Certification Programs, hundreds of resources, expert reviews and support, the chance to work with real-world finance and research tools, and more.