VARA Function
Calculates the sample variance of a given set of values
What is the VARA Function?
The VARA Function[1] is categorized under Excel Statistical functions. VARA is very similar to the VAR function. It will calculate the sample variance of a given set of values.
Variance is a statistical measure used across a set of values to identify the amount that the values vary from the average value.
As a financial analyst, the VARA Function can be useful in calculating variance in revenues or expenses. Portfolio managers often use this function to measure and keep track of their portfolio risk level.
Formula
=VARA(number1,[number2],…)
The VARA function uses the following arguments:
- Number1 (required argument) – This is the first argument corresponding to a population.
- Number 2,.. (optional argument) – Here, the number arguments can be up to 254 values or arrays of values that provide at least two values to the function. However, we can only enter up to 30 number arguments in Excel 2003 and earlier versions.
When providing the arguments, we need to remember that VARA is used when we are calculating the variance for a sample of a population. If we wish to calculate the variance for an entire population, then we should use the Excel VARP function.
VAR vs. VARA function
Both the functions are similar, but they differ in the following ways:
- When an array of values containing logical values is provided, VAR ignores logical values, whereas VARA will assign the value 0 for the FALSE logical value and 1 for the TRUE logical value.
- Text – including empty text “”, text representations of numbers, or other text – within arrays or reference arguments are ignored by VAR but counted as zero by VARA.
How to use VARA to calculate variance in Excel?
As a worksheet function, VARA can be entered as part of a formula in a cell of a worksheet. To understand the uses of the function, let’s see an example:
Example
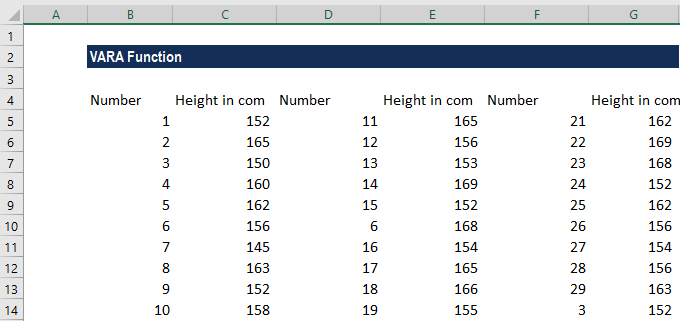
Suppose we are given data about the height of children from three cities, as shown below:
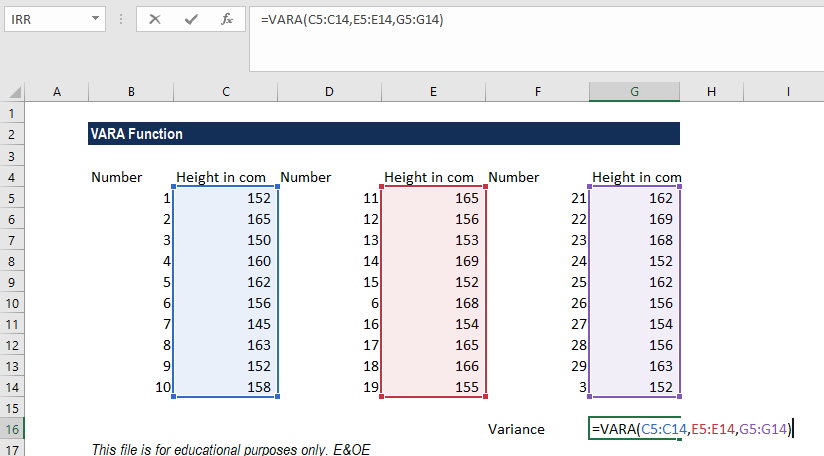
For variance, the formula used is:
We get the results below:
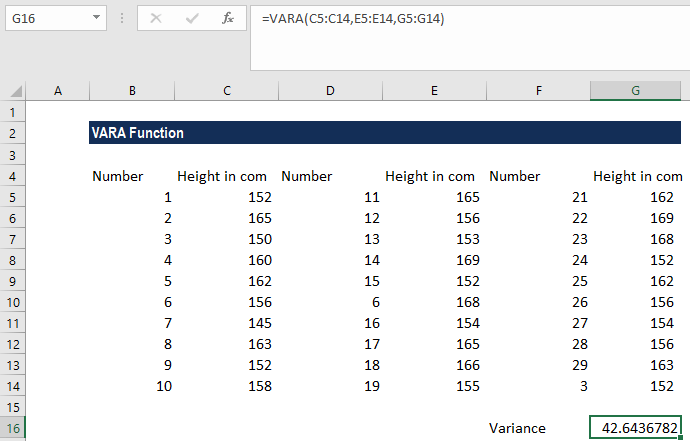
In the example above, we took the arguments for the VARA function as input in the form of three cell ranges. However, we can also enter the figures directly, either as individual numbers or number arrays.
A few things to remember about the VARA Function
- #DIV/0 error – Occurs if we did not provide any numeric values as arguments.
- #VALUE! error – Occurs when any of the values provided directly to this function are text values that cannot be interpreted as numbers.
Click here to download the sample Excel file
Additional Resources
Thanks for reading CFI’s guide to important Excel functions! By taking the time to learn and master these functions, you’ll significantly speed up your financial modeling analysis. To learn more, check out these additional CFI resources:
- Excel Functions for Finance
- Advanced Excel Formulas Lessons
- COVARIANCE.P Function
- VAR.S Function
- See all Excel resources
Article Sources
Excel Tutorial
To master the art of Excel, check out CFI’s Excel Crash Course, which teaches you how to become an Excel power user. Learn the most important formulas, functions, and shortcuts to become confident in your financial analysis.

Launch CFI’s Excel Crash Course now to take your career to the next level and move up the ladder!


