WEIBULL.DIST Function
Returns the Weibull distribution for a supplied set of parameters
Excel Weibull Distribution
The WEIBULL.DIST Function[1] is categorized under Excel Statistical functions. It will return the Weibull distribution for a supplied set of parameters. This guide to the Excel Weibull distribution will show you how to use it step-by-step.
As a financial analyst, the function is useful in reliability analysis. For example, we can use the Excel Weibull distribution formula to measure the mean time of failure of a piece of equipment in the production process. We can look to determine, “How many failures will occur in the next quarter, six months, and year? What will it cost? What is the best corrective action to reduce the risk and losses?”
Introduced in MS Excel 2010, the WEIBULL.DIST function is the updated version of the WEIBULL function.
Formula for the Excel Weibull Distribution
=WEIBULL.DIST(x,alpha,beta,cumulative)
The WEIBULL.DIST function uses the following arguments:
- X (required argument) – This is the value at which the function is to be calculated. It must be greater than or equal to zero.
- Alpha (required argument) – This is a parameter to the distribution. It is the shape parameter to the distribution. It must be greater than 0.
- Beta (required argument) – This is the scale parameter to the Excel Weibull distribution and it must be greater than 0.
- Cumulative (required argument) – This is a logical argument denoting the type of distribution to be used, which can either be TRUE (Weibull Cumulative Distribution Function) or FALSE (Weibull Probability Density Function).
The Weibull Probability Density Function is given by the equation:
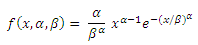
Where x is the independent variable, α is the shape parameter, and β is the scale parameter.
The Weibull Cumulative Distribution Function equation is:
![]()
To learn more, launch our free Excel crash course now!
How to use the Excel WEIBULL Distribution Function
To understand the uses of the WEIBULL.DIST function, let’s consider a few examples:
Example
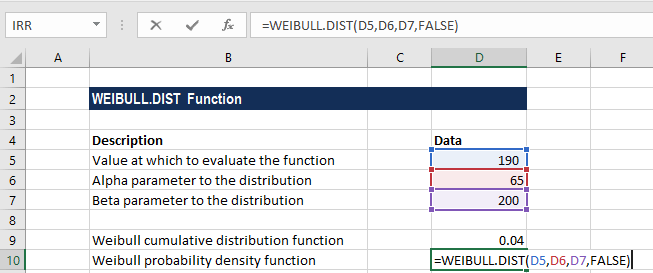
Suppose we are given the following data:
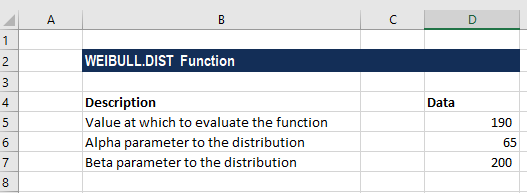
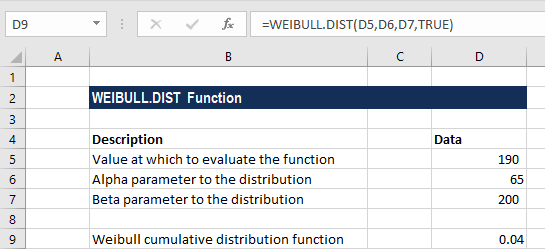
The formula to be used for the Weibull Cumulative Distribution Function is:
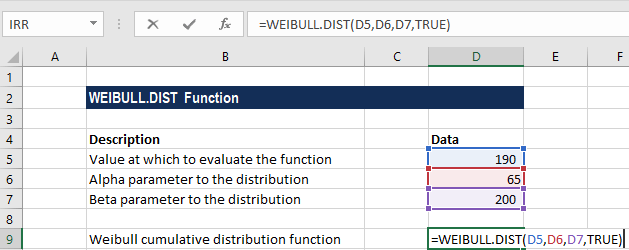
We get the result below:
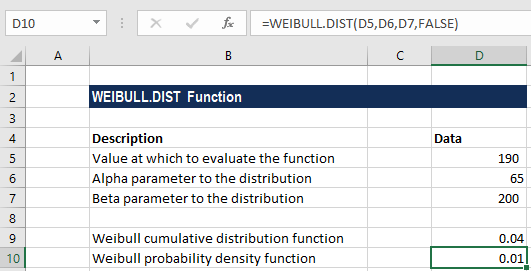
The formula to be used for the Weibull Probability Density Function is:
We get the result below:
A few notes about the WEIBULL.DIST Function
- #VALUE! error – Occurs when x, alpha, or beta values provided are non-numeric.
- #NUM! error – Occurs when:
- When the given value of x is less than 0; or
- When the given value of alpha or beta argument is less than or equal to 0.
Free Excel Course
To keep learning about Excel functions and developing your skills, check our Free Excel Crash Course! Learn how to create more sophisticated financial analysis and models to become a successful financial analyst.
Additional Resources
Thanks for reading CFI’s guide to the Excel Weibull Distribution function. By taking the time to learn and master these Excel functions, you’ll significantly speed up your financial analysis. To learn more, check out these additional CFI resources:
- Excel Functions for Finance
- Advanced Excel Formulas Course
- Advanced Excel Formulas You Must Know
- DEVSQ Function
- LOGNORM.INV Function
- See all Excel resources
Article Sources
Excel Tutorial
To master the art of Excel, check out CFI’s Excel Crash Course, which teaches you how to become an Excel power user. Learn the most important formulas, functions, and shortcuts to become confident in your financial analysis.

Launch CFI’s Excel Crash Course now to take your career to the next level and move up the ladder!


