The LOGNORM.INV Function[1] is categorized under Excel Statistical functions. It will calculate the inverse lognormal distribution in Excel at a given value of x. We can use the function to analyze data that’s been logarithmically transformed.
LOGNORMAL distribution is often used in financial analysis to help make investment decisions. It is often used in analyzing stock prices, as normal distribution cannot be used to model stock prices. This is because the normal distribution includes a negative side and stock prices cannot fall below zero.
The LOGNORM.INV function is useful in financial analysis when we are given the probability and we wish to find the value of x. For example, we can use the function to know the probability of a stock price rising and want to find the stock price that is x.
Also, the function is useful in pricing options. The Black-Scholes model uses the lognormal distribution as its basis to determine option prices.
Formula
=LOGNORM.INV(probability,mean,standard_dev)
The LOGNORM.INV function uses the following argument:
Probability (required argument) – This is the probability associated with the lognormal distribution.
Mean (required argument) – The mean of In(x).
Standard_dev (required argument) – This is the standard deviation of In(x).
Remember, If p = LOGNORM.DIST(x,…), then LOGNORM.INV(p,…) = x.
How to use Inverse Lognormal Distribution in Excel?
To understand the uses of the LOGNORM.INV function, let’s consider an example:
Example
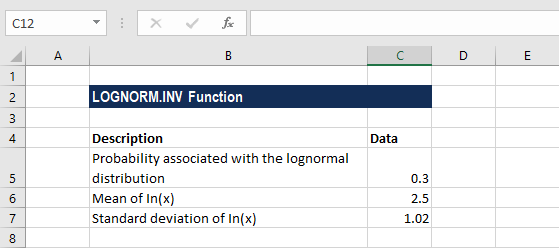
Suppose we are given the following data:
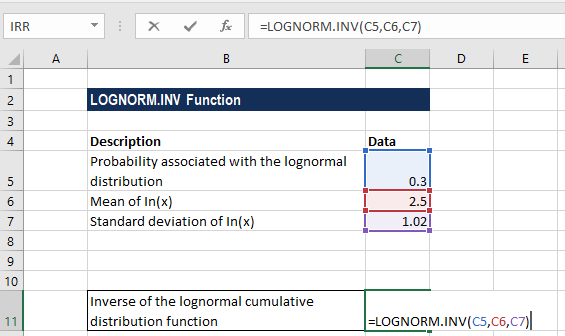
Using the probability, mean, and standard deviation given above, the formula for calculating the inverse of lognormal cumulative distribution is shown below:
We get the result below:
Notes about Inverse Lognormal Distribution Excel
#NUM! error – Occurs when:
The argument x given is less than or equal to zero; or
The argument standard_dev is less than or equal to zero.
#VALUE! error – Occurs when any of the given arguments is non-numeric.
The LOGNORM.INV function was introduced in Excel 2010 and hence is unavailable in earlier versions. For older versions, we can use the LOGINV function.
Free Excel Course
Work your way toward becoming an expert financial analyst by checking out our Free Excel Crash Course. Learn how to use Excel functions and create sophisticated financial analysis and financial models.
Additional Resources
Thanks for reading CFI’s guide to important Excel functions! By taking the time to learn and master these functions, you’ll significantly speed up your financial analysis. To learn more, check out these additional CFI resources:
To master the art of Excel, check out CFI’s Excel Crash Course, which teaches you how to become an Excel power user. Learn the most important formulas, functions, and shortcuts to become confident in your financial analysis.
Take your learning and productivity to the next level with our Premium Templates.
Upgrading to a paid membership gives you access to our extensive collection of plug-and-play Templates designed to power your performance—as well as CFI's full course catalog and accredited Certification Programs.
Gain unlimited access to more than 250 productivity Templates, CFI's full course catalog and accredited Certification Programs, hundreds of resources, expert reviews and support, the chance to work with real-world finance and research tools, and more.