CVP Analysis Template
CVP Analysis Template
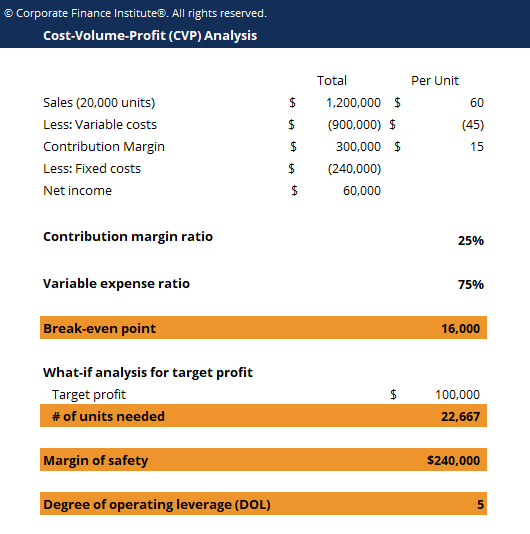
This CVP analysis template helps you perform a break-even analysis, calculate the margin of safety and find the degree of operating leverage.
Here is a screenshot of the CVP analysis template:
Download the Free CVP Analysis Template
Cost Volume Profit (CVP analysis), also commonly referred to as Break Even Analysis, is a way for companies to determine how changes in costs (both variable and fixed) and sales volume affect a company’s profit. With this information, companies can better understand overall performance by looking at how many units must be sold to break even or to reach a certain profit threshold or the margin of safety.
#1 CM Ratio and Variable Expense Ratio
CM Ratio = Contribution Margin / Sales
Variable Expense Ratio = Total Variable Costs / Sales
#2 Break-Even Point
BEP = Total Fixed Costs / CM per Unit
#3 Changes in Net Income (what-if analysis)
# of Units = (Fixed Costs + Target Profit) / CM Ratio
#4 Margin of Safety
Margin of Safety = Actual Sales – Break-even Sales
#5 Degree of Operating Leverage (DOL)
DOL = CM / Net Income
More Free Templates
For more resources, check out our business templates library to download numerous free Excel modeling, PowerPoint presentation, and Word document templates.
Excel Tutorial
To master the art of Excel, check out CFI’s Excel Crash Course, which teaches you how to become an Excel power user. Learn the most important formulas, functions, and shortcuts to become confident in your financial analysis.

Launch CFI’s Excel Crash Course now to take your career to the next level and move up the ladder!


