Gantt Chart Template
Gantt Chart Template
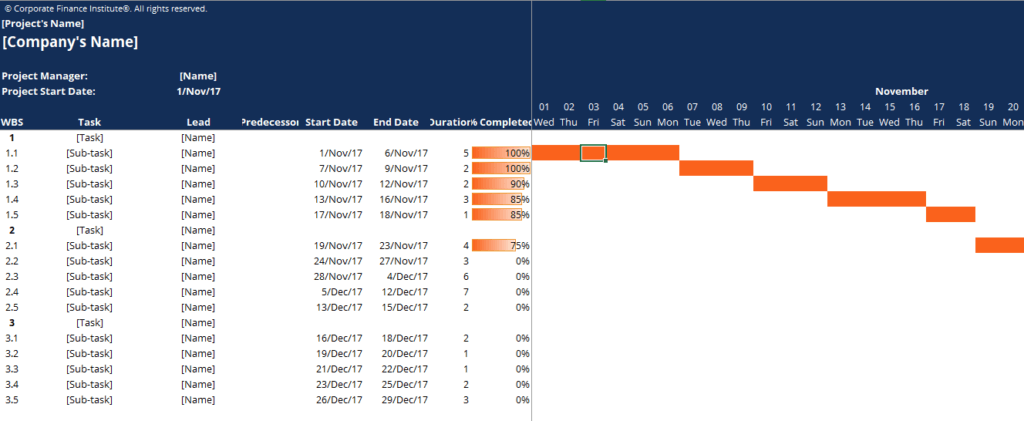
This Gantt chart template will help you use Excel to build a project schedule using a bar chart.
Below is a screenshot of the Gantt chart template:
Download the Free Template
Download CFI’s Excel template to advance your finance knowledge and perform better financial analysis.
The Gantt Chart is a type of a bar chart used to depict a project schedule. The Gantt Chart is a powerful project management tool that illustrates the start and finish dates of project elements, as well as the sequence and dependencies between project elements. The chart provides project managers with the opportunity to monitor and manage tasks and resources in a project, as well as the opportunity to check whether the project remains on the track.
Elements of a Gantt Chart
To use a Gantt Chart effectively, you must know the key elements of this type of chart.
- Tasks and sub-tasks are listed on the left side
- Dates are located at the top
- Bars represent the length of each task and sub-task
- Milestones are the tasks crucial to a project’s success and are represented as diamonds on the chart
More Free Templates
For more resources, check out our business templates library to download numerous free Excel modeling, PowerPoint presentation, and Word document templates.
Excel Tutorial
To master the art of Excel, check out CFI’s Excel Crash Course, which teaches you how to become an Excel power user. Learn the most important formulas, functions, and shortcuts to become confident in your financial analysis.

Launch CFI’s Excel Crash Course now to take your career to the next level and move up the ladder!


