Get Certified for
Capital Markets (CMSA®)
From equities and fixed income to derivatives, the CMSA certification bridges the gap from where you are now to where you want to be — a world-class capital markets analyst.
A tool used in assessing the price volatility of a fixed-income security
Duration is one of the fundamental characteristics of a fixed income security (e.g., a bond), alongside maturity, yield, coupon, and call features. It is the most commonly used tool in the bond markets as an assessment of the interest rate sensitivity of a fixed income security.
Since the interest rate is one of the most significant drivers of a bond’s value, duration measures how much changes in the yield-to-maturity (YTM) of the instrument will ultimately impact the bond’s price.
A fixed income security with a greater duration indicates a higher sensitivity to interest rates and thus, the greater the interest rate risk it has. And as the price of most fixed income securities have an inverse relationship with yields, a security with a greater duration will have more interest rate risk than a security with a shorter duration.
However, in the markets, duration can also be understood to be a measure of how much a bond price will move given changes in the yield-to-maturity. This interpretation is more correctly called “dollar duration” but market participants stubbornly tend to use this duration definition the most.
Duration is commonly used in the portfolio and risk management of fixed income instruments. Using interest rate forecasts, a portfolio manager can change a portfolio’s composition to align its duration with the expected movement of interest rates.
The term duration is mathematically defined as the sum of the weighted average time of each of the cash flows that make up a bond. In other words, “pure” duration (denoted in years) is how long it will take for an investor to receive the bond’s present value based on the expected future cash flows of the bonds.
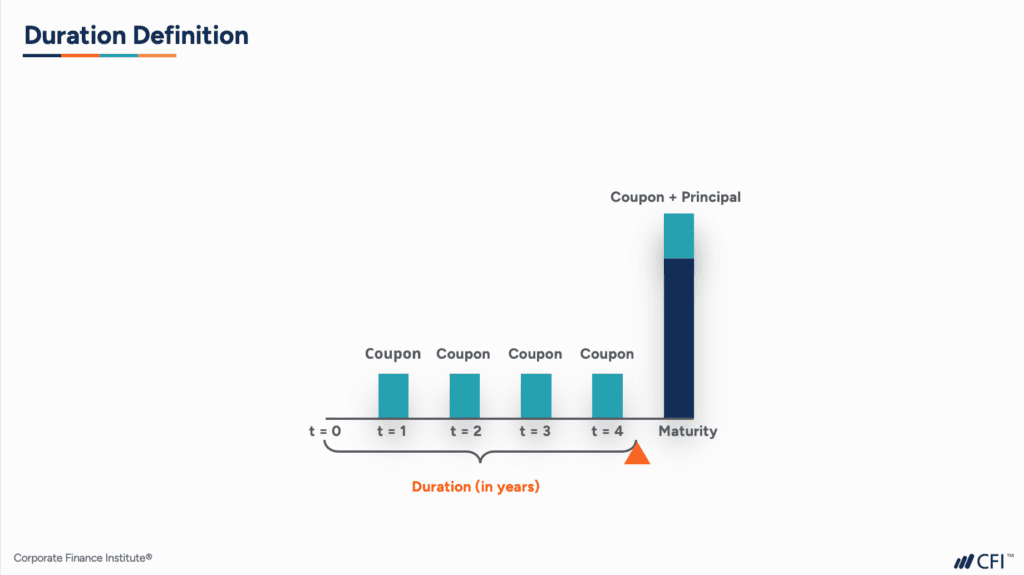
In the figure above, we have a simplified diagram of a five-year fixed-rate, annual-pay coupon bond. Each of the bars represents interest cash flows, or coupons, and a final cash flow consisting of the principal and the final interest payment.
If you imagine this entire cash flow diagram being put on a see-saw, duration is the point where the cash flow balances, also known as a fulcrum. This is the point of time represented by the orange triangle above measured in years.
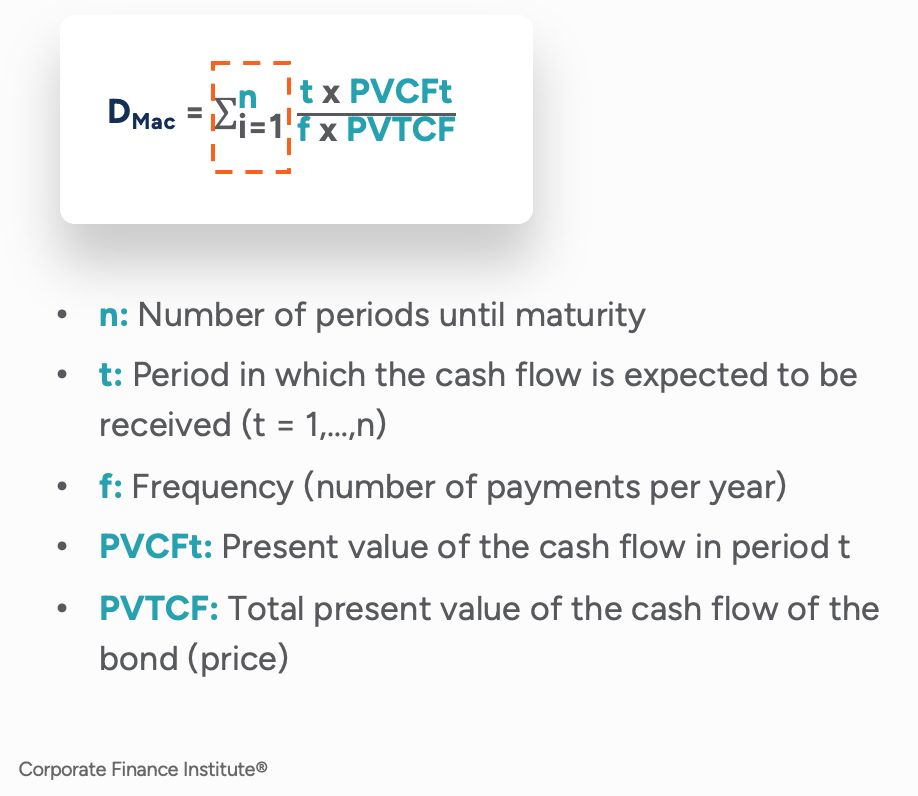
This definition of “pure” duration was introduced by Canadian economist Frederick Macaulay. It is a measure of the time required for an investor to be repaid the bond’s present value by the bond’s total cash flows. The Macaulay duration is measured in units of time (e.g., years).
The formula for the calculation of Macaulay duration (DMac) is expressed in the following way:
Using the formula above, let’s calculate the Macaulay duration for a hypothetical three-year bond. This bond has a 5% coupon that is paid at the end of each year. We begin by calculating the present values of the cash flows from each of the three years.
By adding up the present values of each of the three years, we get to a sum of $102.78, which is the bond’s price.
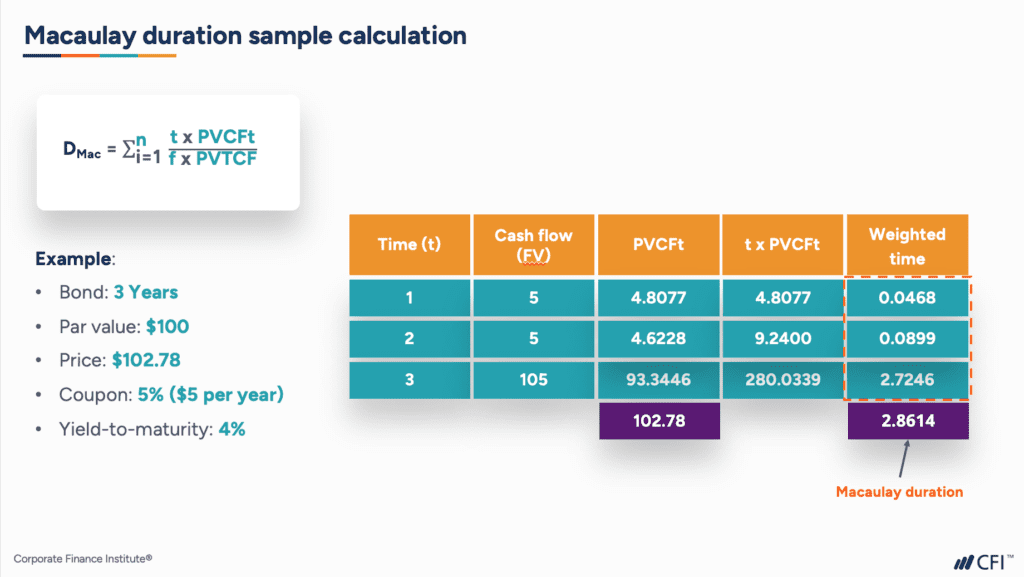
Next, we give a time weight to each of the present values by multiplying the PVCFt by the time period (i.e., 1 for the first year’s cash flows, 2 for the second year’s cash flows, and 3 for the last year’s cash flows).
Lastly, we take each of the PVCFt amounts and divide by the product of the payment frequency and bond price (or PVTCF). This gives us a weighted time figure for each of the years. Combining all the weighted times for each of the three years in our example gives us a Macauley duration of 2.8614 years for our hypothetical bond.
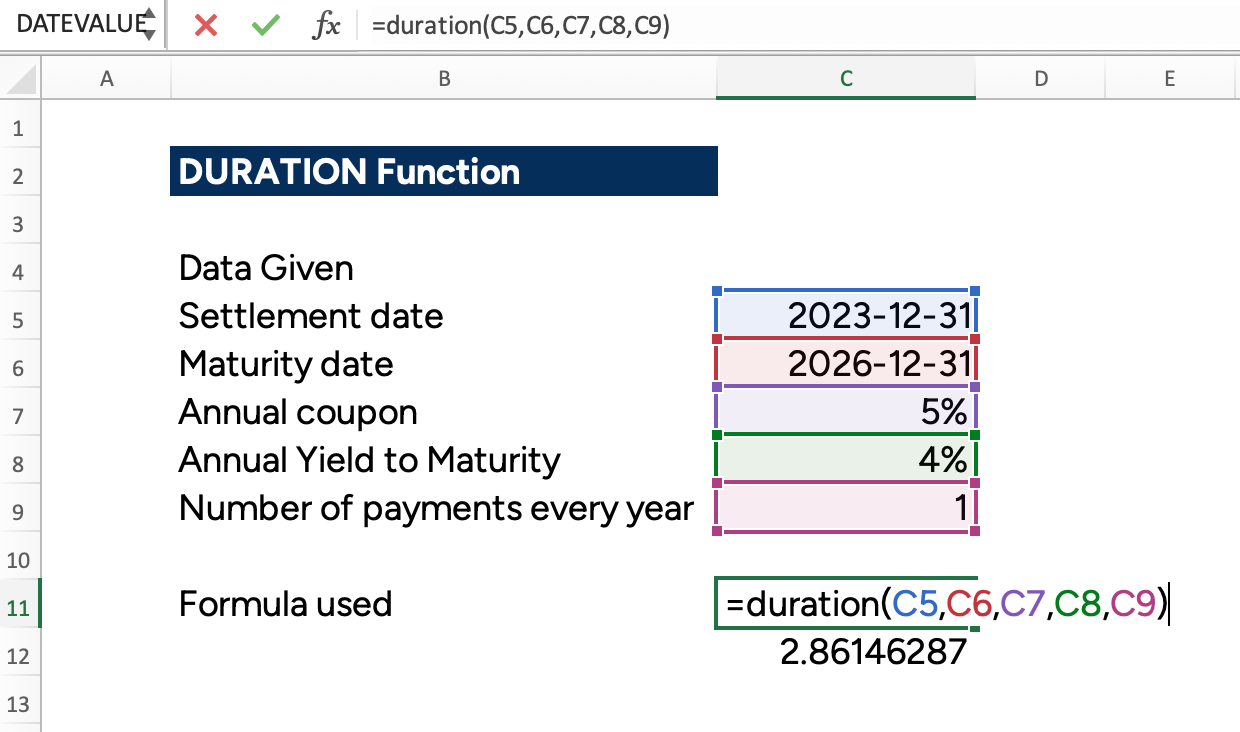
Now, if this calculation becomes too unwieldy to do manually, there is an easier way of calculating duration by using Microsoft Excel. The formula is:
=DURATION(settlement, maturity, coupon, yld, frequency, [basis])
The DURATION function uses the following arguments:
| Basis | Day Count basis |
|---|---|
| 0 or omitted | US(NASD) 30/360 |
| 1 | Actual/actual |
| 2 | Actual/360 |
| 3 | Actual/365 |
| 4 | European 30/360 |
If we use our hypothetical three-year, fixed-rate coupon bond from earlier, the DURATION function on Microsoft Excel gives us the same result as we manually calculated: 2.8614 years.
Let’s dive a bit deeper into the characteristics of Macaulay duration by continuing with our see-saw/fulcrum analogy:
As you can see in the figure above, the duration of a bond is not the same as its maturity. As a matter of fact, for coupon-paying bonds, the duration of that bond will always be shorter than the term to maturity of that bond.
So, what about a zero-coupon bond? As this type of bond is sold at a discount to par, and matures at par, a zero-coupon bond has no coupon payments along the way. Hence, if we picture the see-saw, the duration for a zero-coupon bond would be equal to its term to maturity, as we see in the illustration below.

Using our see-saw, let’s think about how a longer term to maturity impacts duration. In the following diagram, we have a five-year and an eight-year, fixed-rate, annual-pay coupon bond that pays the same coupon rate.

Not surprisingly, a bond with a longer remaining term to maturity will have a longer duration. This makes intuitive sense using our see-saw as a longer bond would require moving the fulcrum further to the right, increasing the Macaulay duration.
Therefore, for a given interest rate increase, it can be expected that the bond with the longer term to maturity will have a larger interest rate risk than a shorter bond with the same coupon.
If we look at coupon payments of a fixed-rate bond, we can also see how two similar bonds with different coupon rates can have different duration measures.
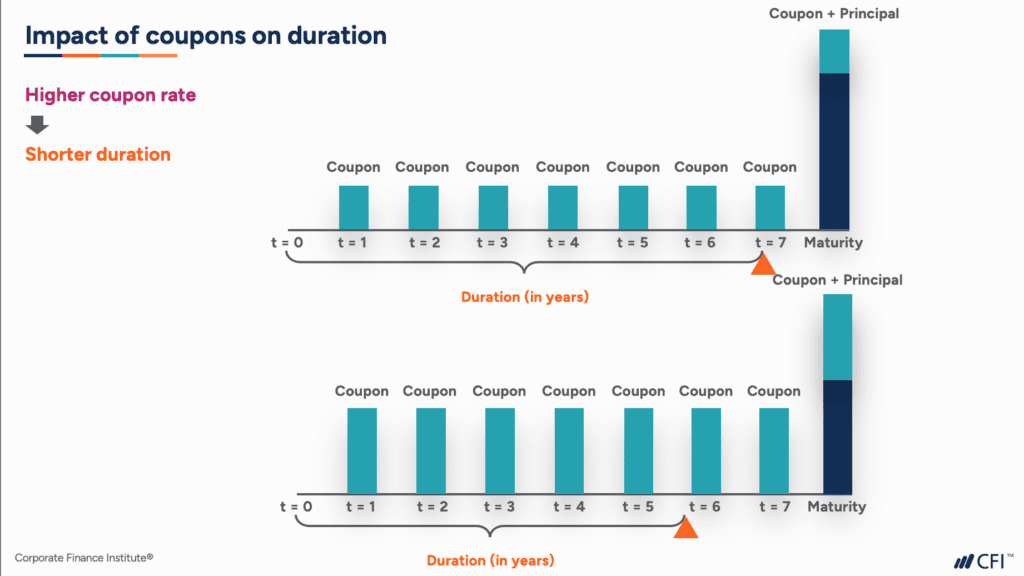
In our example above, using our analogy, you may be able to see that the bond on the bottom with the higher coupon rate will have a shorter duration as more of the weight sits on the left-hand side of the see-saw. Comparing this with the bond on the top with smaller coupon payments, you will see that the fulcrum is further out to the right hand side, meaning a longer duration.
Lastly, we want to think about the relationship between Macaulay duration and yield to maturity. If we consider that the cash flows in our Macaulay duration calculation were discounted back to present value using the yield to maturity, it would reason that an increase in yield to maturity means that the cash flows further out are worth less, so Macaulay duration is shorter.
This means that yield to maturity and Macaulay duration have an inverse relationship.
Our discussion on “pure” or Macaulay duration measures is very much a theoretical construct. In capital markets, a duration measure that gives the weighted average time for all the cash flows, measured in years, isn’t really all that helpful when we are thinking about the interest rate sensitivity of a bond’s price.
Therefore, market participants came up with a more practical duration measure, called modified duration. Relative to the Macaulay duration, the modified duration metric is a slightly more precise measure of price sensitivity.
The modified duration measure takes duration one step further and gives the percentage change in the bond’s price per basis point. Unlike the Macaulay duration, modified duration is measured in percentages.
The formula for the modified duration is as follows:
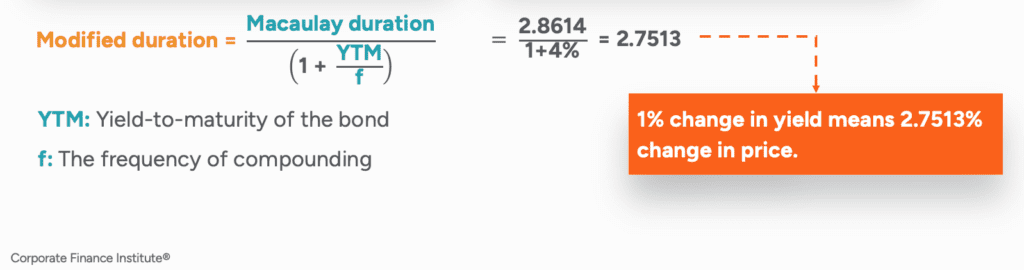
By dividing pure or Macaulay duration by (1+YTM/f), we have modified the duration measure to something that makes a bit more practical sense. In our three year bond example, the Macaulay duration was 2.8614 years, but the modified duration is 2.7513%. This means that a 1% change in yield to maturity will mean a 2.7513% fall in the price of the bond.
For those who work on Wall Street trading desks though, the concept of modified duration was still not direct enough. Modified duration tells you the percentage change in price, but traders are interested in knowing how much the dollar price changes as yields move.
This was the genesis for dollar duration. Dollar duration measures the change in bond prices for a given change in yield to maturity. So, a trader who knows the dollar duration of a bond can easily calculate how much his or her position will change in price given a change in yield.
The conversion from modified duration to dollar duration follows this formula:
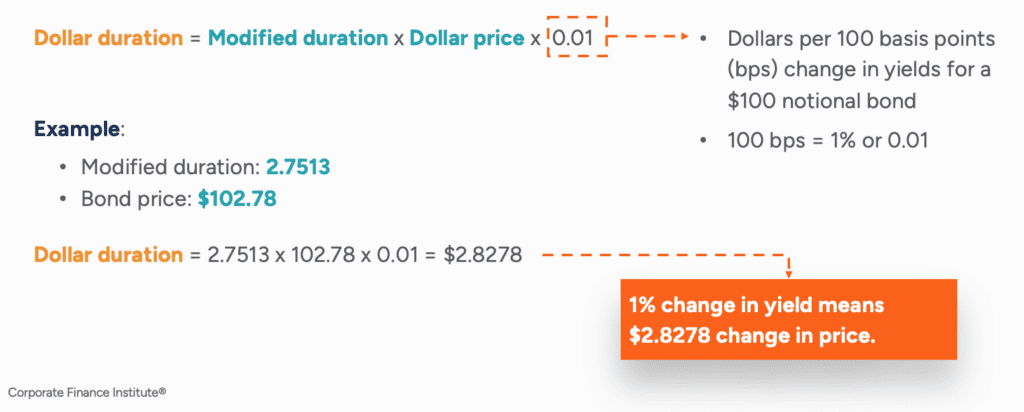
By taking our modified duration measure and multiplying that by the dollar price of our bond and then by a factor of 0.01, we arrive at a duration measure which gives an actual price change for a bond given a 100 basis point (or 1%) change in yield, which is clearly denoted in dollar terms.
Following on with our three-year bond example, the dollar duration works out to be $2.8278 dollars. This is interpreted to mean for a 100 basis point increase in the yield to maturity of our three-year bullet, annual-pay bond, the price will fall by $2.8278, making it much easier to work with. As a matter of fact, dollar duration is also sometimes simply referred to as “risk.”
It is also worth pointing out that even though two bonds may have the same modified duration, they may have different dollar duration measures if the prices of the bonds are not the same. A bond with a higher trading price will have a higher dollar duration than a bond with the same modified duration that trades at a lower price.
Both modified and dollar duration, therefore, are metrics for how sensitive a bond’s price is to movements in its yield. The price of a longer modified or dollar duration fixed-income instrument will move more significantly to a change in yield as compared to the price of a shorter modified or dollar duration instrument.
There are other variations of dollar duration that market participants tend to use.
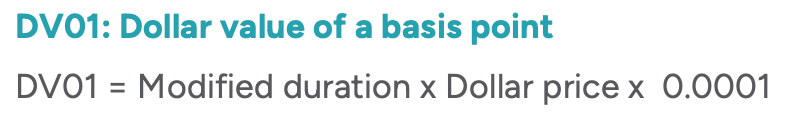
The dollar value of a basis point, known as DV01, is one hundredth the value of dollar duration. It is calculated by taking modified duration multiplied by the dollar price of the bond and then multiplying by a factor of 0.0001 in order to convert it to a basis point measure.
This is useful for market practitioners to get an idea of a change in bond price for movements in yield in 1 basis point increments. On trading floors, you will also hear DV01 called PVBP (the Price Value of a Basis Point).
This measure, abbreviated as YV0.01, is the opposite way of looking at DV01. This duration measure is less commonly used but essentially indicates how much a 0.01% price move in a bond will impact the yield of that instrument.
Even more specific is the yield value change of a 1/32nd move in price, known as YV32 for short. In certain fixed income markets, such as US government bonds and US mortgage-backed securities markets, the price is quoted in 1/32nds. This measure is meant to simplify the understanding of the impact to a bond’s yield for a 1/32nd (or a “tick”) move in the price of the bond.
Effective duration is a useful measure of the duration for bonds with embedded options (e.g., callable bonds). A bond with an embedded option tends to behave differently from an option-free bond when yields move as the bond may be either called or put if the embedded option is in-the-money. This means that the price change for a given change in yield is not constant.
As such, unlike the modified duration and Macaulay duration, effective duration looks at the actual change in duration for an upward and downward change in yield to maturity for an instrument.
The effective duration is calculated using the following formula:

Where:
Additionally, effective duration may also be useful when looking at option-free bonds in instances of large yield moves, as duration is not a constant figure due to the concept of convexity.

Convexity can be either negative or positive:
This occurs when the duration and the yield of a bond decrease or increase together, thus, they are positively correlated. The yield curve for bonds with positive convexities usually follows an upward movement.
This occurs when there is an inverse relationship between the yield and the duration. It means that with a decline in duration, there is an increase in yield. Therefore, they are negatively correlated. The yield curve for a bond with a negative convexity usually follows a downward movement.
In any event, where we have large movements in yield, it is important to consider that since duration is not a static measure, we should look at effective duration as opposed to modified duration.
However, duration only reveals one side of a fixed income security. A full analysis of the fixed income asset must be done using all available characteristics.
CFI’s Fixed Income Fundamentals Course covers the essential topics for fixed-income valuation.
One interesting thing about duration is that it is additive. By that, it means that the duration of individual securities in a portfolio can be combined into a duration for that entire portfolio.
There are generally two methods for calculating the duration of a bond portfolio:
While the first approach is the more theoretically correct approach, it is harder to implement in practice. Therefore, the second approach below is the more commonly method used by fixed income portfolio managers.
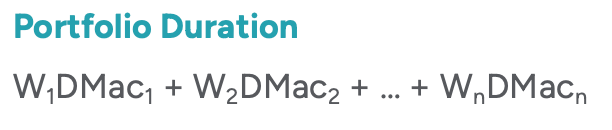
Where:
However, this approach is far from perfect as it assumes that any yield changes are a parallel shift across the entire yield curve (for example, yields in the one-year part of the curve move up the same number of basis points as the two-, three-, five- and 10-year parts of the curve) when, in reality, changes in interest rates are seldom uniform across the curve.
Connect what you just learned to a clear career path with CFI’s role‑based courses and certification programs.
Thank you for reading CFI’s guide on Duration. To keep advancing your career, the additional CFI resources below will be useful:


