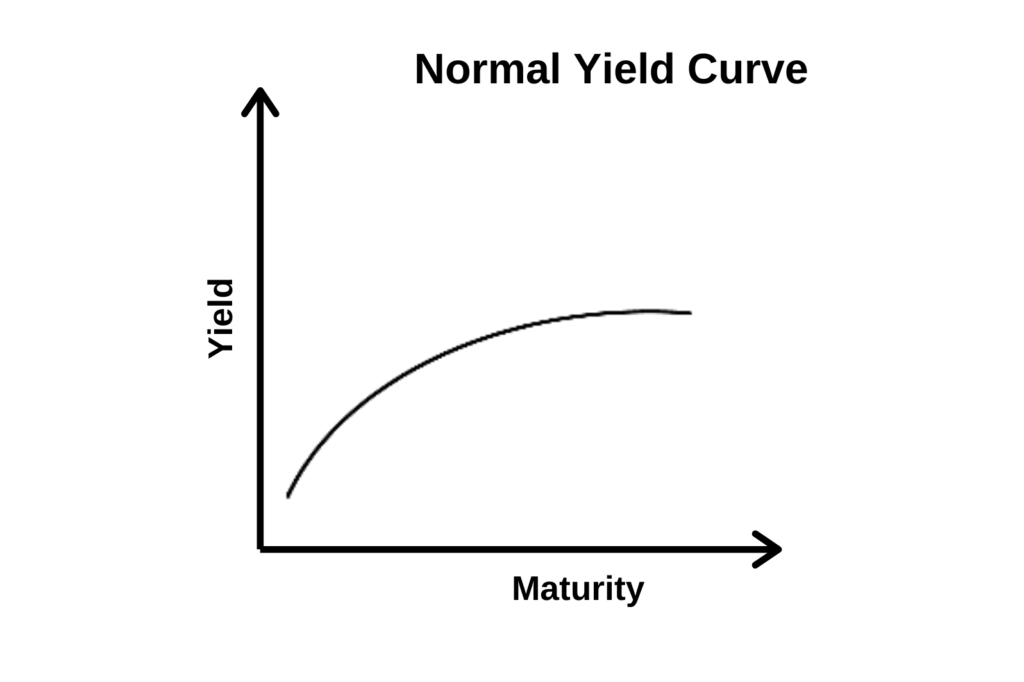
Normal Yield Curve
A graph that shows the association between the yield on bonds and maturities
What is a Normal Yield Curve?
A normal yield curve is a graph that shows the association between the yield on bonds and maturities. In a normal yield curve, short-term debt instruments with the same credit quality as long-term debt instruments provide higher yields than the latter, due to the unusual considerations to the time horizon and risk perceptions. The curve gives the interest rates an upward slope, which rises as it moves from the left to the right.
In addition, the normal yield curve is derived when investors reap the benefits of longer maturity bonds with higher potential yield. The high rates of interest on long-term maturities imply compensation for trading on the longer end of the curve, and motivation for the investors to embrace long-term investments. The curve is commonly applied in the Treasury bonds market, and it is a leading indicator of economic activities.
Financial analysts focus on the slope of the curve to forecast the future trends of short-term interest rates. An upward sloping yield predicts higher interest rates across financial markets. Conversely, a downward sloping yield curve indicates lower interest rates.
In addition to providing a picture of the emerging economy, a normal yield curve is widely used by investors to foresee the future conditions of financial markets.
Summary
- A normal yield curve is a graphical representation of the link between the yield on bonds and maturities.
- It is considered more robust in predicting market conditions compared to other market indicators and variables.
- The curve is not created by the government or a single entity, unlike other metrics.
Understanding the Normal Yield Curve
More often, the market expects that the most significant risks offer a higher reward; hence, the yield curve is considered a normal yield curve. In essence, long-term investments are exposed to higher levels of risks, including a potential increase in defaults and fluctuation in interest rates. It means that an investor cannot use the money invested for a long period of time, translating to maximized incentives, which are based on the time value of money component of the interests.
Investing in longer-term and higher-yielding notes is one of the strategies of maximizing investment – a fact that is represented by the upward slope movement of the normal yield curve. The rates of interest are a result of compensated high risks that characterize long-term investments and the minimal risks that are common in short ventures.
The normal or positive shape of the curve represents the anticipated changes in interest rates as maturity dates draw closer. Thus, the normal yield curve is mostly linked with positive economic growth.
Yield Curves as an Indicator
The normal yield curve indicates the relationship between changes in bond yields with varied maturity time. Therefore, in addition to showing savvy investors where there is potential profit, it also offers a way to interpret general evaluation of the financial market.
As a useful indicator tool, the curve shows the uncertainties in the economy. The curve is neither created by the government nor a single entity. Rather, it is produced by evaluating the feel of the current market situation to gather data for use by investors in creating a baseline.
Types of Yield Curves
In the bond markets, three additional yield curves encompass the collective sentiments of investors about the future conditions of key macroeconomic indicators, such as ratings of issuer’s credit, changes in interest rates, and inflation.
1. Inverted yield curve
The inverted yield curve, for example, gives a scenario of interest rates where short-term debt instruments have comparatively higher interest rates despite having the same credit rating. It is most commonly used to predict an imminent economic downturn.
2. Flat yield curve
Another curve is the flat yield curve, which reflects an interest rate environment where the yield of different securities is similar or close to each other. The curve resembles the flat line curve that represents similar long and short-term bonds. Illustratively, the flat yield curve indicates a near-zero interest differential between short-term and long-term debt instruments.
3. Humped yield curve
Apart from the inverted yield curve and the flat yield curve, there is also the humped yield curve. The main feature of the humped curve is that it starts by rising upwards, before falling for long-term maturities. The movement connotes the sentiments of the investors about the uncertainties of macroeconomic variables.
Normal Yield Curve and Other Indicators
Generally, the normal yield curve is a more reliable indicator compared to other leading indicators and variables. The ex-post accuracy of the normal yield curve’s projection results tends to have more predictive power. While indicators such as interest rates and stock prices may exhibit similar performance to the normal yield curve in some circumstances, the former bears more statistical power and evidence.
For example, the normal yield curve has proven to be an efficient tool as a test of statistical significance and predictor of the recession that bears numerous indicators. Its predictive effectiveness is hinged on its social components.
More Resources
CFI offers the Commercial Banking & Credit Analyst (CBCA)™ certification program for those looking to take their careers to the next level. To keep learning and developing your knowledge base, please explore the additional relevant resources below:


