Get Certified for Financial Modeling (FMVA)®
Gain in-demand industry knowledge and hands-on practice that will help you stand out from the competition and become a world-class financial analyst.
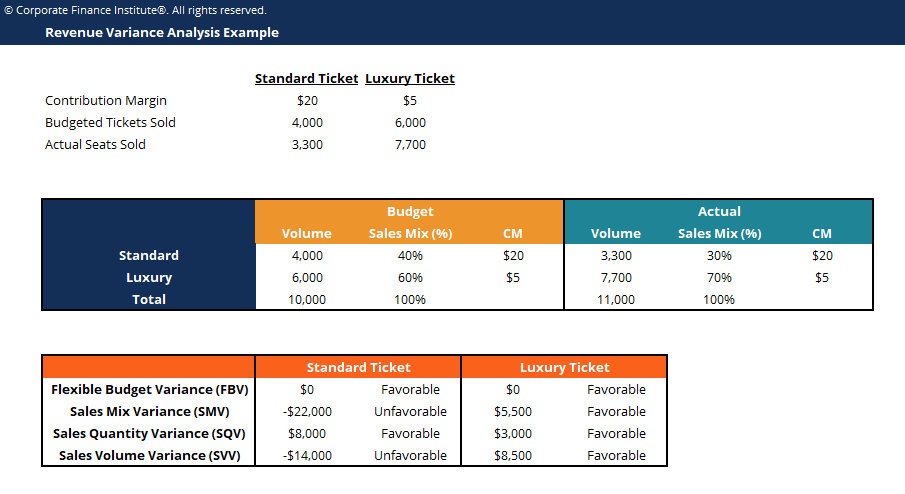
Analysis of the difference between planned and actual numbers
Variance analysis is the analysis of the difference between planned and actual numbers. The sum of all variances gives a picture of the overall over-performance or under-performance for a particular reporting period. For each item, companies assess their favorability by comparing actual costs to standard costs in the industry.
For example, if the actual cost is lower than the standard cost for raw materials, even with the same volume, it would result in a favorable price variance (i.e., cost savings). However, if the standard quantity was 10,000 pieces of material and 15,000 were required in production, this would be an unfavorable quantity variance because more material was used than anticipated.
Learn variance analysis step by step in CFI’s Budgeting and Forecasting course.
When standards are compared to actual performance numbers, the difference is what we call a “variance.” Variances are computed for both the price and quantity of materials, labor, and variable overhead and are reported to management.
Once variances are identified, presenting them clearly to stakeholders is critical—many teams apply the FRAME Technique to structure their messaging.
Management should only pay attention to those that are unusual or particularly significant. Often, by analyzing these variances, companies are able to use the information to identify a problem so that it can be fixed or simply to improve overall company performance.
As mentioned above, materials, labor, and variable overhead consist of price and quantity/efficiency variances. Fixed overhead, however, includes a volume variance and a budget variance.
Learn variance analysis step by step in CFI’s Budgeting and Forecasting course.
When calculating variances, the simplest way is to follow the column method and input all the relevant information. This method is best shown through the example below:
XYZ Company produces gadgets. Overhead is applied to products based on direct labor hours. The denominator level of activity is 4,030 hours. The company’s standard cost card is below:
In January, the company produced 3,000 gadgets. The fixed overhead expense budget was $24,180. Actual costs in January were as follows:
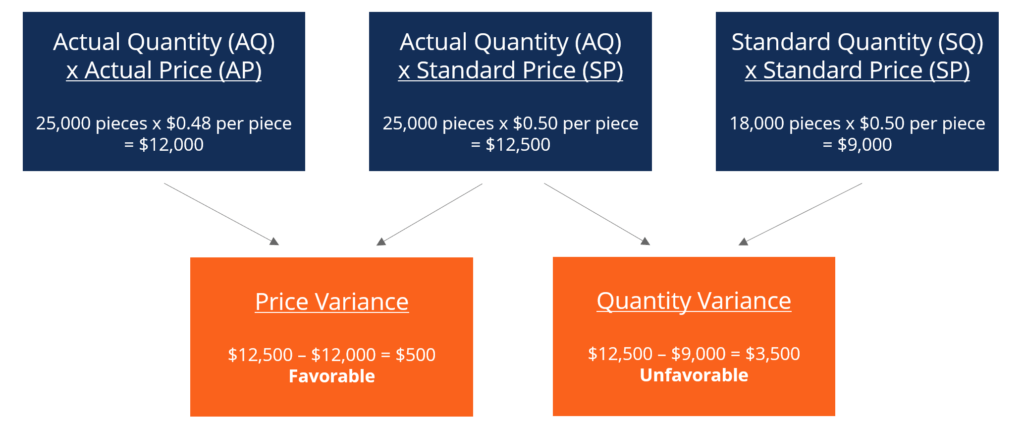
Adding these two variables together, we get an overall variance of $3,000 (unfavorable). It is a variance that management should look at and seek to improve.
Although price variance is favorable, management may want to consider why the company needs more materials than the standard of 18,000 pieces. It may be due to the company acquiring defective materials or having problems/malfunctions with machinery.
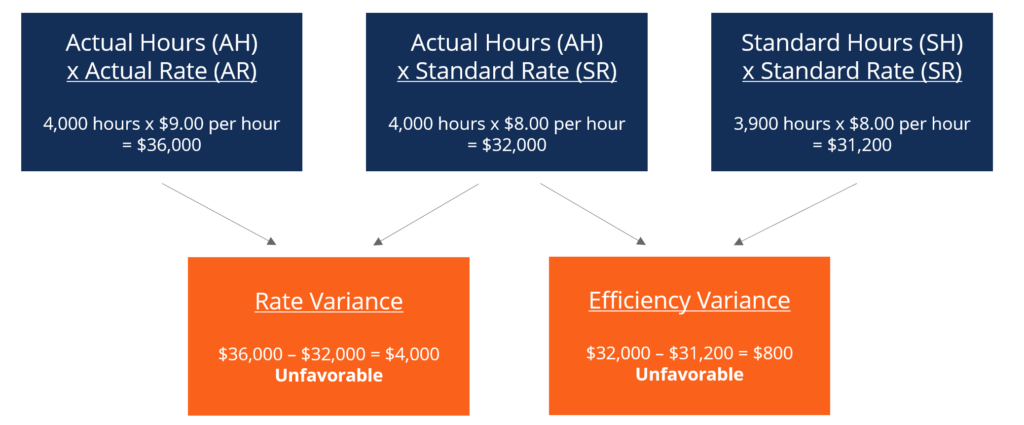
Adding the two variables together, we get an overall variance of $4,800 (Unfavorable). It is another variance that management should look at. Management should address why the actual labor price is a dollar higher than the standard and why 1,000 more hours are required for production.
The same column method can also be applied to variable overhead costs. It is similar to the labor format because the variable overhead is applied based on labor hours in this example.
Learn variance analysis step by step in CFI’s Budgeting and Forecasting course.
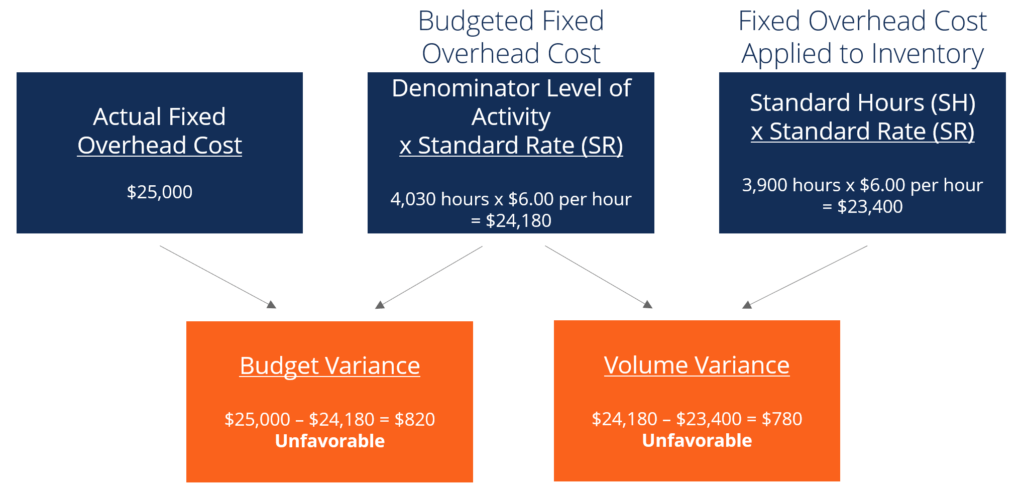
Adding the budget variance and volume variance, we get a total unfavorable variance of $1,600. Once again, this is something that management may want to look at.
Enter your name and email in the form below and download the free template (from the top of the article) now!
In cost accounting, a standard is a benchmark or a “norm” used in measuring performance. In many organizations, standards are set for both the cost and quantity of materials, labor, and overhead needed to produce goods or provide services.
Quantity standards indicate how much labor (i.e., in hours) or materials (i.e., in kilograms) should be used in manufacturing a unit of a product. In contrast, cost standards indicate the actual cost of a labor hour or a material. Standards, in essence, are estimates of the prices or quantities a company will incur.
Connect what you just learned to a clear career path with CFI’s role‑based courses and certification programs.
Thank you for reading CFI’s guide to Variance Analysis. To help you advance your career, check out the additional CFI resources below:


