Get Certified for
Capital Markets (CMSA®)
From equities and fixed income to derivatives, the CMSA certification bridges the gap from where you are now to where you want to be — a world-class capital markets analyst.
A graphical representation of the relationship between the interest rate paid by an asset and the time to maturity
An inverted yield curve often indicates the lead-up to a recession or economic slowdown. The yield curve is a graphical representation of the relationship between the interest rate paid by an asset (usually government bonds) and the time to maturity. The interest rate is measured on the vertical axis and time to maturity is measured on the horizontal axis. Normally, interest rates and time to maturity are positively correlated.
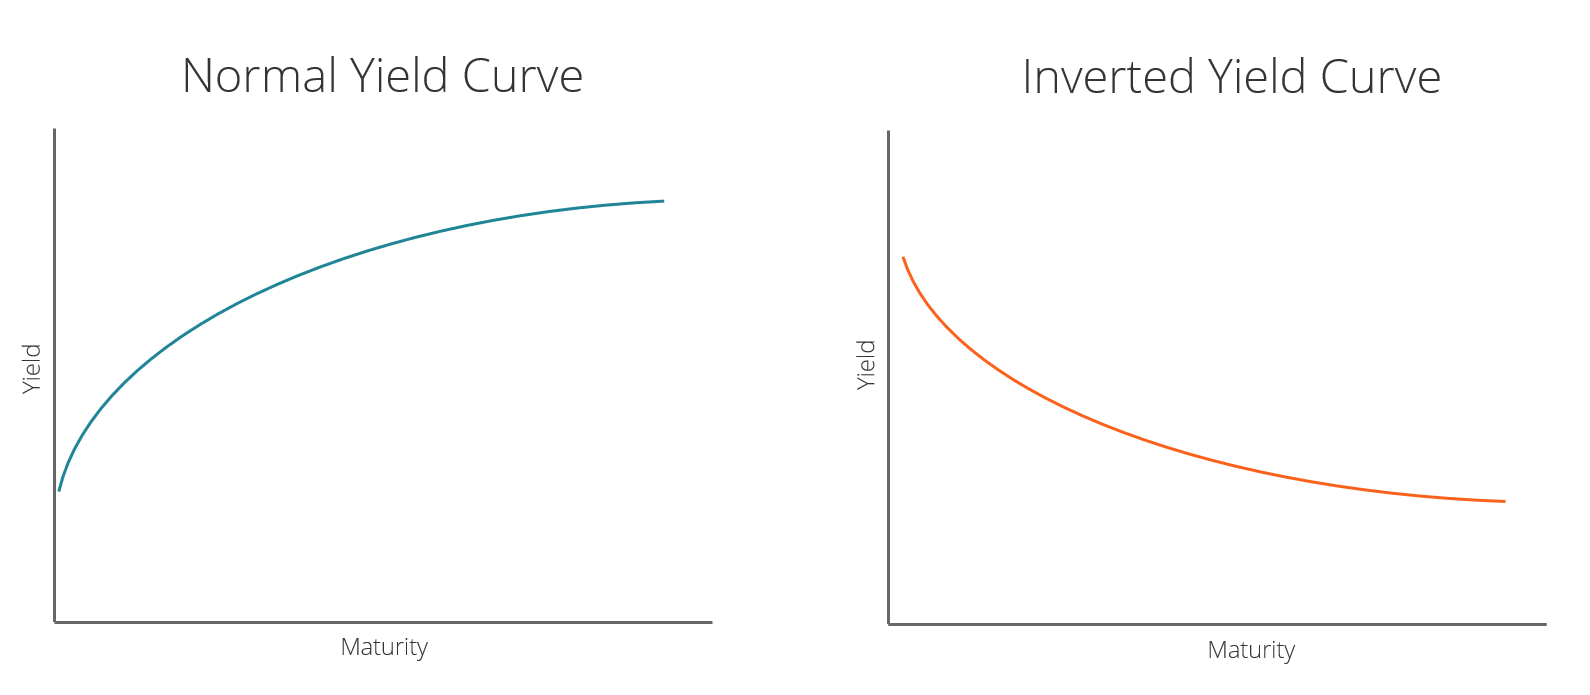
Under normal conditions, interest rates go up with an increase in the time to maturity. This results in a positive slope for the yield curve. If interest rates and time to maturity are negatively correlated, then the resulting inverted yield curve will show a negative slope.
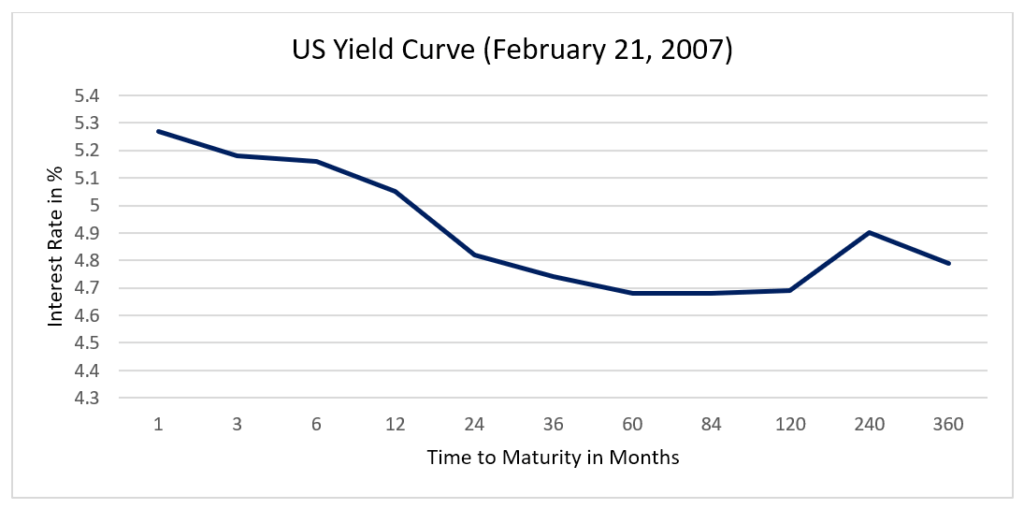
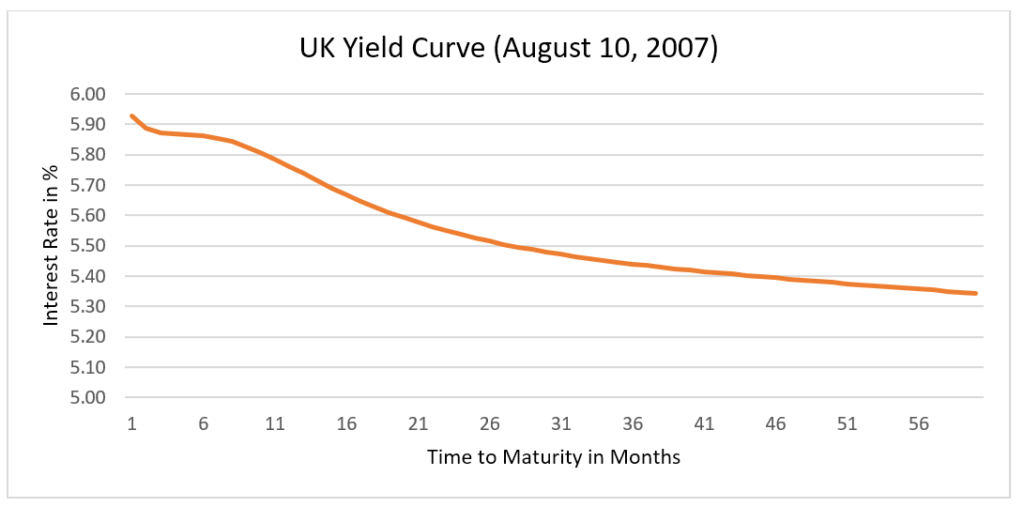
Historically, the yield curve assumes a negative slope in the lead-up to recessions and economic slowdowns.
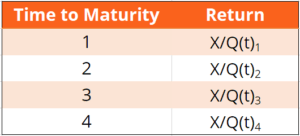
Consider the following example: An N-year government bond costs Q(t)N in period t and pays an amount X in period t+N years. Therefore, the return on a one-year bond is X/Q(t)1. The one-year bond pays X in period t+1.
Consider an investor who does the following:
The return on this sequence of two one-year investments is X/Q(t)1 * X/Q(t+1)1.
If investors are risk neutral, then the return on a two-year bond should be equal to the expected return on a sequence of two one-year bonds. In general, the expected return on N one-year bonds should be equal to the return on one N-year bond.
The E around future bond prices represents expected values since investors don’t know future bond prices.
The yield curve is often seen as a bond market measure of confidence in the economy. A positive slope implies the bond market expects the economy to do well, and a negative slope implies the bond market expects the economy to do badly.
A negatively sloped – inverted – yield curve implies that investors expect interest rates to be lower in the future. This, in turn, implies that investment returns generally will be lower in the future. Lower returns lead to a decrease in investments that is associated with economic stagnation and deflation.
Central banks often counter deflationary pressures in the economy by reducing short-term interest rates. Therefore, an expectation of economic slowdown is consistent with a negatively sloped yield curve.
The spread between a 10-year bond and a 2-year bond is often used to check for inversion of the yield curve. If the 10-2 spread falls below 0, then the yield curve is negatively sloped on average between 24 months and 120 months (time to maturity).
Thank you for reading this CFI guide to understanding an inverted yield curve. CFI is the official provider of the global Capital Markets & Securities Analyst (CMSA®) certification program, designed to help anyone become a world-class financial analyst. To keep advancing your career, the additional CFI resources below will be useful:


