Get Certified for
Business Intelligence (BIDA®)
Develop analytical superpowers by learning how to use programming and data analytics tools such as VBA, Python, Tableau, Power BI, Power Query, and more.
A statistical tool that is used to identify the dispersion of data
Sum of squares (SS) is a statistical tool that is used to identify the dispersion of data as well as how well the data can fit the model in regression analysis. The sum of squares got its name because it is calculated by finding the sum of the squared differences.
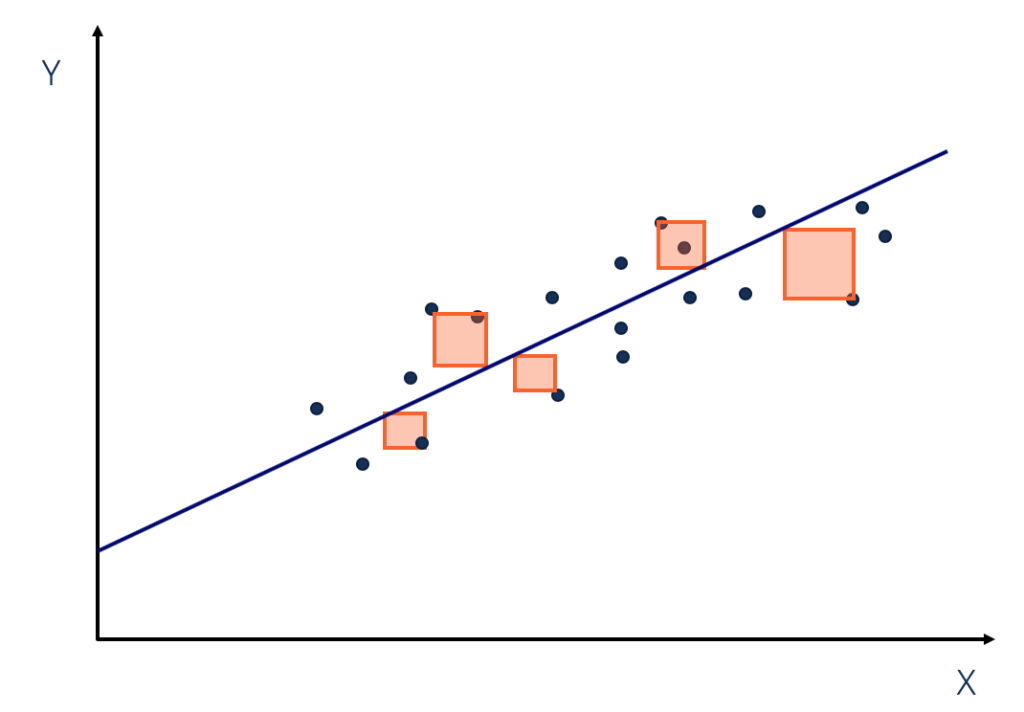
This image is for illustrative purposes only.
The sum of squares is one of the most important outputs in regression analysis. The general rule is that a smaller sum of squares indicates a better model, as there is less variation in the data.
In finance, understanding the sum of squares is important because linear regression models are widely used in both theoretical and practical finance.
In regression analysis, the three main types of sum of squares are the total sum of squares, regression sum of squares, and residual sum of squares.
The total sum of squares is a variation of the values of a dependent variable from the sample mean of the dependent variable. Essentially, the total sum of squares quantifies the total variation in a sample. It can be determined using the following formula:
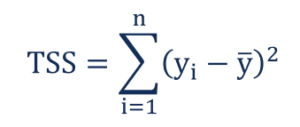
Where:
The regression sum of squares describes how well a regression model represents the modeled data. A higher regression sum of squares indicates that the model does not fit the data well.
The formula for calculating the regression sum of squares is:
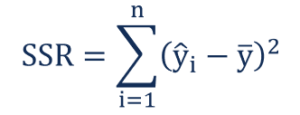
Where:
The residual sum of squares essentially measures the variation of modeling errors. In other words, it depicts how the variation in the dependent variable in a regression model cannot be explained by the model. Generally, a lower residual sum of squares indicates that the regression model can better explain the data, while a higher residual sum of squares indicates that the model poorly explains the data.
The residual sum of squares can be found using the formula below:
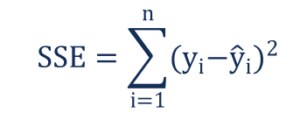
Where:
The relationship between the three types of sum of squares can be summarized by the following equation:
![]()
Thank you for reading CFI’s guide to Sum of Squares. To keep learning and advancing your career, the following CFI resources will be helpful:


