Get Certified for
Business Intelligence (BIDA®)
Develop analytical superpowers by learning how to use programming and data analytics tools such as VBA, Python, Tableau, Power BI, Power Query, and more.
A measure of how much data points in any statistical distribution differ from each other and from their mean value
Variability is a term used to describe how much data points in any statistical distribution differ from each other and from their mean value. The statistical tools used to measure variability are range, standard deviation, and variance.

It is a useful metric in finance when applied to measure the variability of investment returns. Generally, risk-averse investors prefer investments that project low variability in returns.
The price of Asset X is $100, and it provides different returns in different years, as shown in the following table:
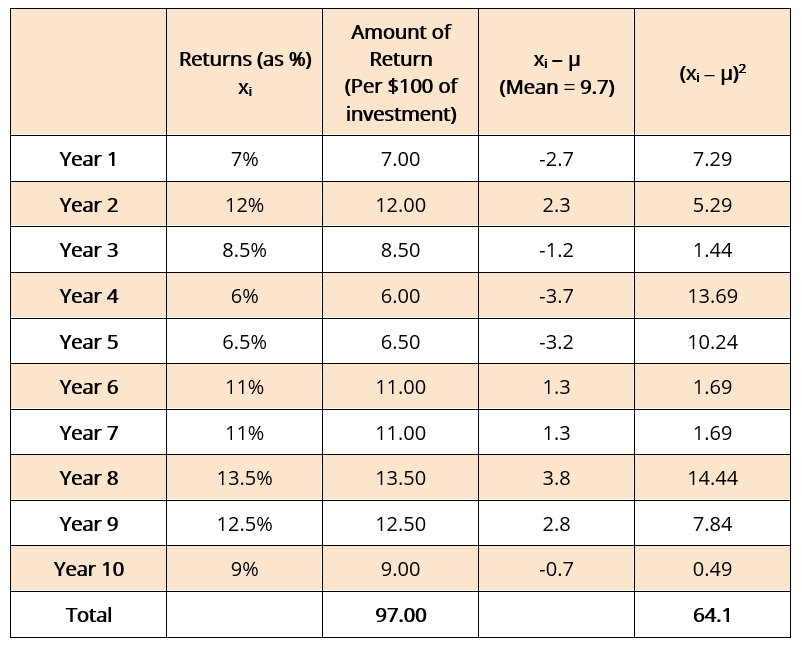
The variability in the returns of Asset X can be calculated using the following statistical tools:
Range is simply the difference between the highest and lowest values in the data set under consideration. In the example above:
Range = 13.5 – 6 = 7.5
Standard deviation measures the extent to which all data points differ from their mean value. The formula for calculating standard deviation is
Where:
In the illustration, Mean Value = (7+12+8.5+6+6.5+11+11+13.5+12.5+9) / 10 = 9.7%.
σ = √ (64.1 / 10) = 2.53 (approximately)
The variance value is equal to the square of standard deviation. In our example, variance (σ2) = 6.41.
Standard deviation and variance are more popular as measures of variability since both tools capture the essence of every value in the data set and not just the extreme values.
While calculating the returns on an investment, the terms variability and variance are often used interchangeably since both act as indicators of risk.
Variance essentially shows the spread of actual data points around their mean value. A higher magnitude of variance signifies that data points are widely distributed around the mean, while a lower value means that data points are closely distributed around the mean.
The returns on some investments remain fairly constant over a long period of time, whereas the returns on others vary each year widely. High variability in the returns is associated with a high degree of risk since returns fluctuate every year.
On the other hand, low variability is associated with a relatively low degree of risk since returns do not vary as much. The higher the variability, the greater the uncertainty of getting an assured return.
Investors often use the variability in returns as a factor to compare different investment options. Risk-averse investors always choose the investment that offers returns with low variability.
Investments A, B, and C offer the following annual returns (in %) over a period of five years:
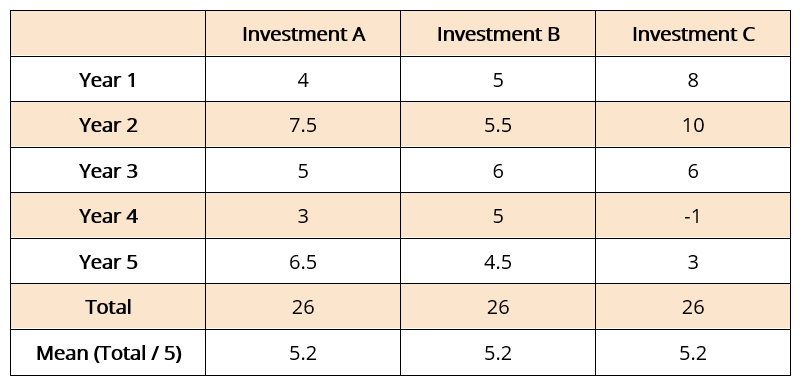
All of the options offer the same mean return, but their returns are spread differently around the mean. An investor must calculate the variance on each of the returns to choose which investment offers the least risk.
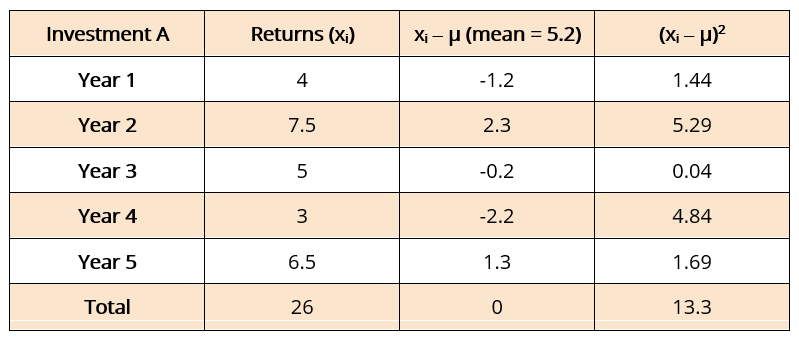
Variance of Investment A = 13.3 / 5 = 2.66
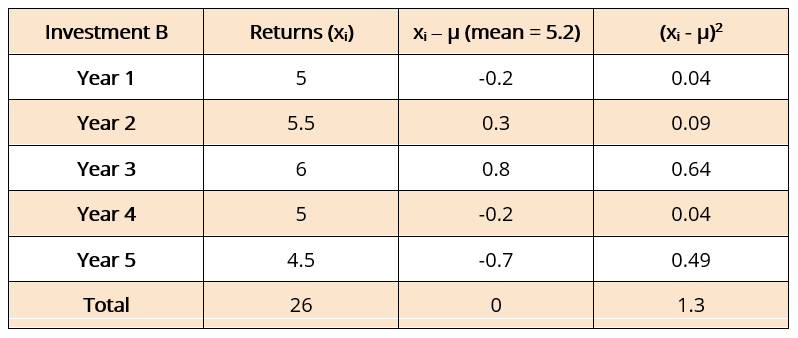
Variance of Investment B = 1.3 / 5 = 0.26
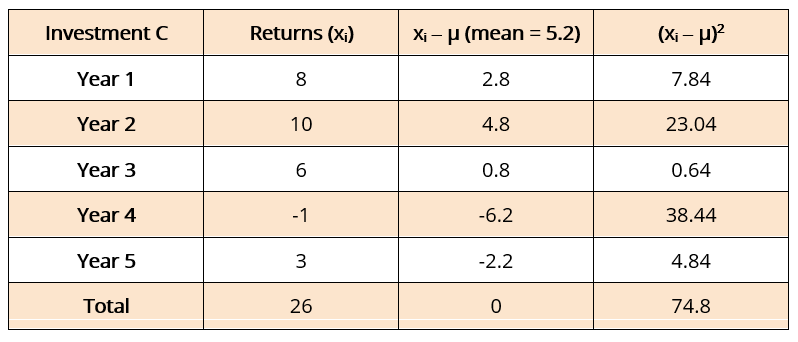
Variance of Investment C = 74.8 / 5 = 14.96
Investors looking to invest in the safest options will put their money in Investment B. Investors who wish to undertake high risk will invest in C. As is evident from the example, investments with a high degree of risk also provide prospects of the highest returns, but they are also the most likely to provide negative returns.
Thank you for reading CFI’s guide to Variability. To keep learning and developing your knowledge base, please explore the additional relevant resources below:


