Get Certified for
Capital Markets (CMSA®)
From equities and fixed income to derivatives, the CMSA certification bridges the gap from where you are now to where you want to be — a world-class capital markets analyst.
An indicator that helps in determining the direction the asset price is moving and the strength of the price movement
The Directional Movement Index (DMI) is an indicator that helps in determining the direction the asset price is moving and the strength of the price movement. It does so by comparing the current price with previous lows and highs, drawing lines of positive directional movement (+DI) and negative directional movement (-DI).
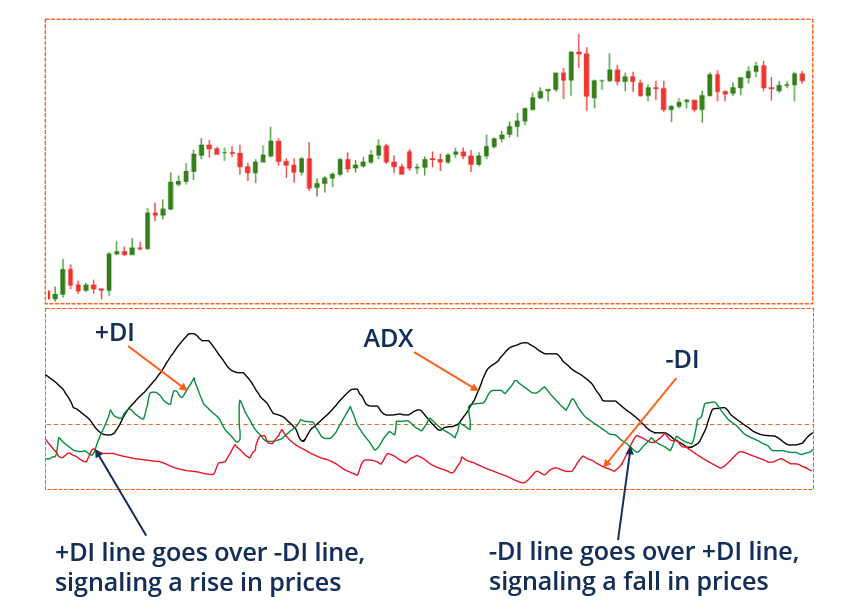
The placement of +DI and -DI, with respect to each other, determines the direction of pressure in price. If +DI is higher than -DI, the pressure in price is more upward, indicating a buying signal, and if -DI is higher, the pressure in price is more downward, indicating a selling signal.
The Directional Movement Index also includes an optional line called the Average Directional Index (ADX), showing the strength of the upward or downward trend.
True Range (TR) is the maximum of the absolute value of:
If current high minus previous high is greater than the previous low minus current low,
+DM = Current High – Previous High
If +DM is negative, then +DM is taken as 0
If current high minus previous high is less than the previous low minus current low,
-DM = Previous Low – Current Low
If -DM is negative, then -DM is taken as 0
If both +DM and -DM are positive and +DM is greater than -DM, then the value of +DM is current high minus previous high and -DM is 0. Similarly, if -DM is greater than +DM, then the value of +DM is 0, and -DM is previous low minus current low.
TR for the first 14 periods = Total of first 14 readings of TR
Next 14 period TR = First 14 period TR – (Previous 14 period TR)/14 + Current TR

+DI = (Smoothed +DM / Smoothed TR value) x 100
-DI = (Smoothed -DM / Smoothed TR value) x 100
4. Compute Directional Index (DX)

The Directional Movement Index (DMI) helps in assessing the trend direction and providing trade signals. If +DI line is higher up than -DI line, the market is believed to be trending upwards, and a long trade can be taken. Similarly, if -DI line is higher up than +DI line, a short trade is taken, as the market is believed to be trending downwards.
The DMI can be used to confirm the trend of the price signal. The trend is stronger if the spread between +DI and – DI is larger. If +DI is far above -DI, it indicates a strong upward trend. If -DI is far above +DI, the price trend is strongly moving downwards.
The market is considered to be trending if the ADX line is over 25 and ranging if the ADX line is under 25. Sometimes traders consider the above 20 ADX reading as trending and non-trending for below 20. A reading of above 25 for ADX signifies a trend of a strong signal, whereas below 25 signifies that there is no strong trend, and the price is moving either in a weak trend or sideways. The ADX reading should be over 25 or 20 for trading strategies that trade trends, and lower than 20 for trading a ranging strategy where the price movement is sideways.
It is common to obtain +DI, -DI, and ADX in the same window; however, the indicators can also be used individually. Some traders may only analyze ADX for the strength of the trend, whereas some traders may choose to analyze only the direction movement lines of the DMI to assess the direction of price movement.
To learn more about the Average Directional Movement Index (ADX), check out CFI’s Trading Using Technical Analysis course!
CFI is the official provider of the global Capital Markets & Securities Analyst (CMSA)™ certification program, designed to help anyone become a world-class financial analyst. To keep advancing your career, the additional resources below will be useful:


