Get Certified for
Capital Markets (CMSA®)
From equities and fixed income to derivatives, the CMSA certification bridges the gap from where you are now to where you want to be — a world-class capital markets analyst.
A stock market index in Hong Kong
The Hang Seng Index (HSI) is a stock market index in Hong Kong. It records and monitors the daily changes in stock prices of the 50 largest Hong Kong stock market companies. As the companies represent almost 60% of the Hong Kong Stock Exchange, the Hang Seng Index is the main indicator of the Hong Kong market’s overall performance. Hang Seng Indexes Company Limited is currently responsible for compiling and maintaining the index.
The Hang Seng Index debuted in November 1969. It was conceived by Ho Sin Hang, the chairman of the Hang Seng Bank, who intended to create a Dow Jones Index for Hong Kong.
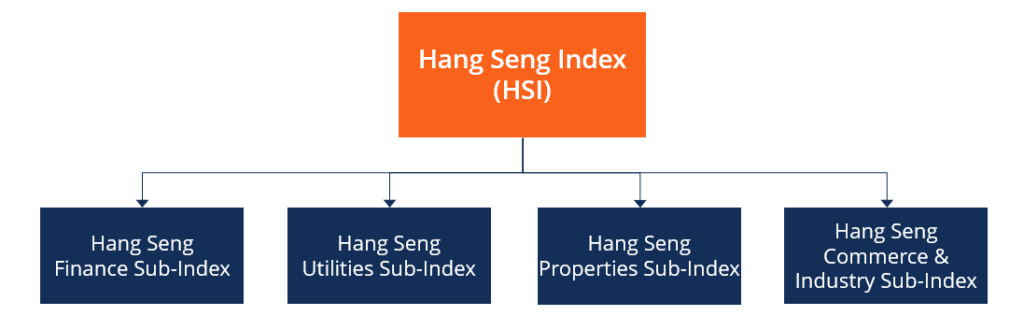
In 1985, four sub-indices were created to make the index clearer. Constituent stocks are now classified into four distinct sectors:
The stocks that constitute the Hang Seng Index include major banks, utility companies, real estate companies, and entertainment companies. Notable constituent stocks include:
For a stock to be considered for inclusion in the Hang Seng Index, it is subjected to extensive analysis with the help of external consultation. To be qualified for selection, companies must meet certain minimum requirements:
Once eligible candidates are identified, final selections take place. They are based on the eligible companies’:
The Hang Seng Index is calculated based on a free-float-adjusted, market capitalization-weighted approach. The following formula is used:
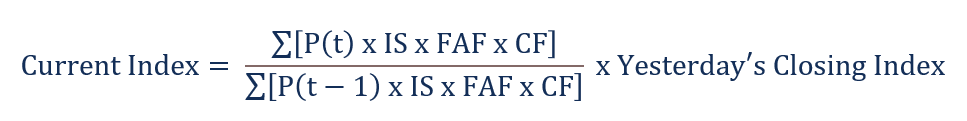
Where:
Although the Hang Seng Index was started in 1969, the index was calculated retroactively to 1965. Its base was set at 100 points, equal to the total value of the Hang Seng Index’s constituent stocks when the market closed on July 31, 1964.
On August 31, 1967, the Hang Seng Index reached its all-time low of 58.61. It first passed 10,000 points in December 1993, then passed 20,000 points in December 2006. In October 2007, it passed the 30,000-point milestone for the first time. The Hang Seng Index’s all-time high was set on January 26, 2018, at 33,223.58 points. As of December 2020, the Index sits at around 26,500 points.
Since 1965, the average percentage change in the Hang Seng Index is approximately 19.2% per year. The highest annual return occurred in 1972 when the index rose 147.07%. The lowest annual return occurred in 1974 when it contracted by -60.54%.
In the 2010s, the Hang Seng Index grew by an average of approximately 3.7% per year. The highest returns of the decade were seen in 2017 when the index grew by 35.99%. The lowest returns of the decade occurred in 2011 when it fell by -19.97%.
To monitor daily reports for the Hang Seng Index, investors may use the following reports:
CFI is the official provider of the global Capital Markets & Securities Analyst (CMSA)® certification program, designed to help anyone become a world-class financial analyst. To keep advancing your career, the additional resources below will be useful:


