Get Certified for
Capital Markets (CMSA®)
From equities and fixed income to derivatives, the CMSA certification bridges the gap from where you are now to where you want to be — a world-class capital markets analyst.
A trend line in a trading range that moves sideways
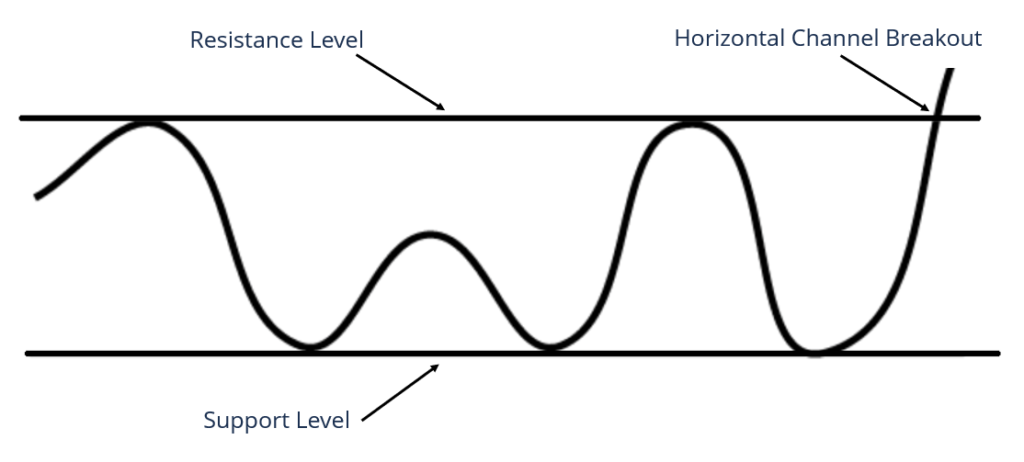
A horizontal channel is a trend line that connects the variable pivot highs and lows to highlight the price movements during a trading period. Otherwise known as a sideway trend or price range, horizontal lines are used by traders for identify breakouts to determine where price action is decisive. Channels are forms of vertical support and resistance in which price faces trouble either rising above or sinking below.
A horizontal channel is a sideways trend with a rectangular pattern. By definition, a horizontal channel consists of four contact points because it needs at least two lows and two highs. It requires equal buying and selling pressure with a sideways price action direction.
A horizontal channel’s trends breakout occurs during price consolidation, a period when the trade is limited within specific price ranges and is characterized by few trading opportunities. The resistance (pivot low) and the support (pivot high) frame out the price movement in a trading session.
The passing trend lines on pivots show a visual picture of prices in action. The paths enable the trader to see the gradual fall or rise of price over time. A new high and a new low represent a buy signal in the price above the horizontal channel and a sell signal in the price below the horizontal channel, respectively.
A horizontal channel is a common chart pattern in every trading period. The opposing forces of buying and selling are similar until a breakdown occurs. Although a horizontal channel is a powerful trend indicator, it is often overlooked.
It’s a high frequency pattern based on technical analysis elements which enable traders to make trading decisions when the odds are in their favor. There are three ways traders can use to locate horizontal channels in a graph.
Apart from the horizontal channel, there are two other channels – ascending and descending channels.
The ascending channel trading pattern is also called a bullish price channel and is a continuation with a positive slope. The sloping parallel lines contain the price actions and show a clearly defined uptrend. Traders can keep opening long positions as long as the stocks’ price remains within the upper and lower channels’ trend line.
The descending channel trading pattern is also referred to as a bearish price channel trading pattern. The bear market continues as long as the stocks’ price actions follow the down-trending channel’s trend lines. However, a pattern ends when there is a breakout on the resistance line that makes a new high.
Trend channels utilize parallel trend lines. In chart analysis, the top channel’s trend line becomes a potential resistance level, while the bottom trend line becomes the support level. Technical investors use support and resistance levels as one of the main areas of focus in chart analysis.
The advantage of using a horizontal channel is that it quickly reveals trading exit and enter points to an investor. Thus, the support and resistance points in a horizontal channel are closely monitored. A horizontal channel can be created using technical analysis indicators that smooth out price action, such as trend lines, moving averages, or Fibonacci retracement levels.
Traders use the buy and sell points within a horizontal channel as a guide to clear and systematic trading. Investors should observe the following rules for entering long and short positions:
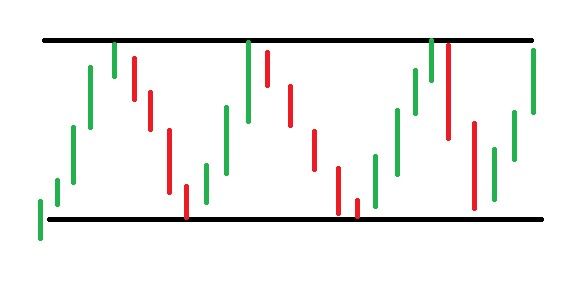
A horizontal channel information is strengthened when candlestick signal information is incorporated. Price movements that occur at the support and resistance levels enhance the predictive value of a horizontal channel.
A horizontal channel also becomes a useful tool for investors when finding a new investment target. It may indicate how worthwhile the next trading period will be in addition to showing investor sentiment by looking at the past trading range.
CFI is the official provider of the Capital Markets & Securities Analyst (CMSA)™ certification program, designed to transform anyone into a world-class financial analyst.
In order to help you become a world-class financial analyst and advance your career to your fullest potential, these additional resources will be very helpful:


