Get Certified for
Capital Markets (CMSA®)
From equities and fixed income to derivatives, the CMSA certification bridges the gap from where you are now to where you want to be — a world-class capital markets analyst.
An oscillator-type indicator primarily used to identify short-term overbought or oversold conditions in the stock market
The TRIN indicator, also known as the ARMS index because it was developed by Richard Arms, is functionally an oscillator-type indicator that is primarily used to identify short-term overbought or oversold conditions in the stock market. It does this by comparing advancing versus declining stocks, along with advancing versus declining volume. TRIN is short for “TRading INdex”.
The TRIN indicator is referred to as a breadth indicator because it gives an indication of how widely spread, in terms of advances versus declines, a stock market movement is, as reflected in a major stock market index such as the S&P 500 Index or the NASDAQ 100 Index.
Because the TRIN indicator factors in both price advances or declines and volume figures, it is seen as indicating both the velocity (advances/declines) and mass (volume figures) of the stock market’s overall price movement.
Looking at the calculation for the TRIN indicator makes it very easy for a trader to understand what the TRIN reflects. The calculation for the TRIN is as follows:
The TRIN first divides the number of advancing stocks for the day by the number of declining stocks for the day. It then divides the volume of advancing stocks by the volume of declining stocks. Finally, it divides the result of the first calculation by the result of the second calculation.
So, for example, if on a given day the number of advancing stocks was 2,275 and the number of declining stocks was 764, then the advance/decline ratio would be 2.98. If the total volume of advancing stocks was 1,176 and the total volume of declining stocks was 164, then the advance/decline volume ratio would be 7.17. The TRIN would then be calculated as:
2.98/7.17 = 0.42
Successfully using TRIN levels to indicate temporary overbought or oversold levels in a market can be a bit tricky. First of all, TRIN values appear to be inverse, in that higher values indicate increased selling while lower values indicate increased buying.
Generally speaking, TRIN values below 0.50 are considered to indicate overbought conditions in which analysts anticipate an impending corrective retracement downward. TRIN values above 3.00 are typically interpreted as indicative of oversold conditions that may give rise to an upside rally. A TRIN value of 1.00 indicates a balanced stock market that is neither overbought nor oversold.
One can quickly see that there’s a wide middle range of possible TRIN values between overbought values below 0.50 and oversold values above 3.00. In order to make the TRIN indicator more useful, analysts look not just at the basic TRIN values but also at how the TRIN value changes throughout a trading day or over a longer period of time, such as during a trading week. By doing so, analysts can more precisely pinpoint what constitutes extreme levels, to one side or the other, in the TRIN under whatever the current market conditions are.
For example, the market might go through a period where TRIN values go no lower than 0.75 and no higher than 2.25. In such market conditions, analysts may determine that those two extreme values accurately reflect overbought and oversold conditions for the market during that specific time period, even though they fall short of what are typically the TRIN value levels that are considered to indicate overbought/oversold conditions.
Some traders and analysts who watch the TRIN indicator focus on the TRIN’s equilibrium value of 1.00 and consider any readings below 1.00 as potential indications of overbought conditions, and any readings above 1.00 as potential indications of oversold conditions.
One of the shortcomings of the TRIN indicator is that its value can fluctuate significantly either intraday or from one trading day to the next even under overall market conditions that would not usually be described as volatile.
In order to smooth out some of the inherent volatility in the TRIN indicator, some traders and analysts prefer to look at a 10-day moving average of the TRIN value.
Analysts commonly use the TRIN indicator to identify market conditions under which the short-term market trend may soon shift from bullish to bearish (when the market is temporarily overbought) or from bearish to bullish (when the market is temporarily oversold). Traders may use the trend to identify potentially profitable buying or selling price levels.
The chart below shows that traders who bought into the market when the TRIN showed values above 3.00, indicating oversold conditions at the market levels indicated by the green up arrows, would have fared very well. However, traders who sold the market based on TRIN values below 0.50, indicating overbought conditions would not have been so profitable over the same time period.
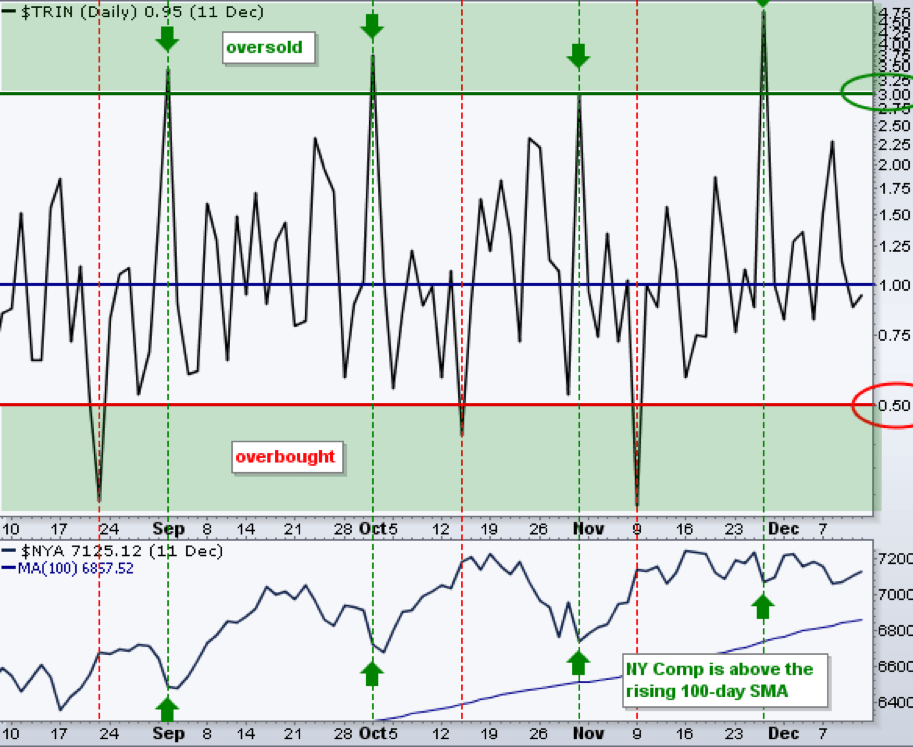
The TRIN is typically a leading indicator – one that projects a market turn before it happens. Looking at the above chart, one can easily see that the TRIN often anticipated an actual turn in the stock market direction by a day or two. While this may afford a trader an opportunity to “sell the top” or “buy the bottom”, most traders will look for confirming price action in stock market index values before investing based on an anticipated market reversal.
When TRIN values are relatively steady and around the 1.00 equilibrium level, many traders will stand aside and wait for further market action before making or adjusting any investments. Market activity that occurs without moving the TRIN indicator very much one way or the other is more likely to prove insignificant for the trading day.


