What Does Undervalued Mean?
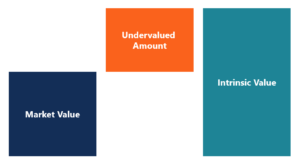
An undervalued asset is an investment that can be purchased for less than its intrinsic value. For example, if a company has an intrinsic value of $11 per share but can be purchased for $8 per share, it is considered undervalued.

Intrinsic Value
An investment is either overvalued or undervalued relative to its intrinsic value. Since an asset’s intrinsic value is subjective, it means that being over/undervalued is also subjective.
Simply put, the intrinsic value of an asset is the price a rational investor would be willing to pay for the asset. It is most commonly the Net Present Value (NPV) of all future cash flows the asset will generate. For a refresher on the topic, see CFI’s guide to valuation methodsValuation MethodsWhen valuing a company as a going concern there are three main valuation methods used: DCF analysis, comparable companies, and precedent transactions. These methods of valuation are used in investment banking, equity research, private equity, corporate development, mergers & acquisitions, leveraged buyouts and finance, as well as financial modelingFree Financial Modeling GuideThis financial modeling guide covers Excel tips and best practices on assumptions, drivers, forecasting, linking the three statements, DCF analysis, Excel modeling and much more. Designed to be the best free modeling guide for analysts by using examples and step by step instructions. Investment banking, FP&A, research, and more specifically, DCF modelsDCF Model Training Free GuideA DCF model is a specific type of financial model used to value a business. DCF stands for Discounted Cash Flow, so the model is simply a forecast of a company’s unlevered free cash flow discounted back to today’s value. This free DCF model training guide will teach you the basics, step by step with examples and images.
Undervalued vs. Overvalued
If the value of an asset trades at its intrinsic value, it is said to be fairly valued (plus or minus a reasonable margin). When an asset moves significantly off that value, it then becomes under/overvalued.
Value Investing
Investors who purchase stocks that are below their intrinsic value are called “value investorsStock Investing: A Guide to Value InvestingSince the publication of "The Intelligent Investor" by Ben Graham, what is commonly known as "value investing" has become one of the most widely respected and widely followed methods of stock picking.” or investors who like “cheap” stocks. While value investing may be a good idea, one issue can involve falling for a “value trap,” which is a low-quality company that seems cheap but isn’t actually worth anything more than its market price.
Ratios for Undervalued Investments
Investors can use several methods to find investments (typically stocks) that are worth more than the price they have to pay for them. Below are examples of some of the most commonly used ratios for assessing whether a stock is overvalued or undervalued:
Price/Net Present Value (P/NPV)
Price/NPV is the best (i.e., most complete) method for valuing a company. To perform the Price/NPV analysis, a financial analyst must build a financial model to forecast the company’s revenues, expenses, and cash flows into the future and calculate the Net Present Value (NPV)Net Present Value (NPV)Net Present Value (NPV) is the value of all future cash flows (positive and negative) over the entire life of an investment discounted to the present. NPV analysis is a form of intrinsic valuation and is used extensively across finance and accounting for determining the value of a business, investment security,. The analyst will then compare the value from the Discounted Cash Flow (DCF) model to the market price of the investment. To learn more, check out CFI’s free financial modeling guideFree Financial Modeling GuideThis financial modeling guide covers Excel tips and best practices on assumptions, drivers, forecasting, linking the three statements, DCF analysis, Excel modeling and much more. Designed to be the best free modeling guide for analysts by using examples and step by step instructions. Investment banking, FP&A, research.
Other Ratios
If an analyst doesn’t have access to enough information (or time) to build a financial model, they may turn to other ratios to assess a company’s value. Other common ratios include:
- Price/Earnings (PE) RatioPrice Earnings RatioThe Price Earnings Ratio (P/E Ratio) is the relationship between a company’s stock price and earnings per share. It gives investors a better sense of the value of a company. The P/E shows the expectations of the market and is the price you must pay per unit of current (or future) earnings
- Price/Book (PB) Ratio
- EV/EBITDA Ratio
- EV/Revenue Ratio
- Price/Cash Flow (P/CF) Ratio
- Dividend Yield and Payout Ratio
When using the above ratios, it’s important to pay careful attention to avoid “value traps” as discussed above. Since companies can temporarily have fluctuations in their financial statements, the above ratios may appear more favorable or unfavorable than they would be over the long run.
A company may incur one-time expenses on their income statement or include impairment of assets on the balance sheet, but they don’t necessarily reflect the ongoing expected performance of the business.
Long vs. Short Strategies
When a stock is undervalued, it presents an opportunity to go “long” by purchasing its shares. When a stock is overvalued, it presents an opportunity to go “short” by selling its shares. Hedge funds and sophisticated investors may use a combination of long and short positions to bet on over/undervalued stocks. To learn more, check out CFI’s trading guidesTrading & InvestingCFI's trading & investing guides are designed as self-study resources to learn to trade at your own pace. Browse hundreds of articles on trading, investing and important topics for financial analysts to know. Learn about assets classes, bond pricing, risk and return, stocks and stock markets, ETFs, momentum, technical.
Additional Resources
CFI is the official provider of the global Financial Modeling & Valuation Analyst (FMVA)™FMVA® CertificationThe Financial Modeling & Valuation Analyst (FMVA)® accreditation is a global standard for financial analysts that covers finance, accounting, financial modeling, valuation, budgeting, forecasting, presentations, and strategy.
certification program, designed to help anyone become a world-class financial analyst. To keep advancing your career, the additional resources below will be useful:
- Bullish and BearishBullish and BearishProfessionals in corporate finance regularly refer to markets as being bullish and bearish based on positive and negative price movements. A bear market is typically considered to exist when there has been a price decline of 20% or more from the peak, and a bull market is considered to be a 20% recovery from the bottom
- Short CoveringShort CoveringShort covering, also called "buying to cover", refers to the purchase of securities by an investor to close a short position in the stock market. The process is closely related to short selling. In fact, short covering is part of short selling
- SignalingSignalingSignaling refers to the act of using insider information to initiate a trading position. It occurs when an insider releases crucial information about a company that triggers the buying or selling of its stock by people who do not ordinarily possess insider information. The actions of the insider are considered a market signal to outsiders.
- Yield CurveYield CurveThe Yield Curve is a graphical representation of the interest rates on debt for a range of maturities. It shows the yield an investor is expecting to earn if he lends his money for a given period of time. The graph displays the bonds' yield on the vertical axis and the time to maturity across the horizontal axis.