Get Certified for Financial Modeling (FMVA)®
Gain in-demand industry knowledge and hands-on practice that will help you stand out from the competition and become a world-class financial analyst.
A free, comprehensive best practices guide to advance your financial modeling skills
Many of the models we encounter today are poorly designed, difficult to maintain, and hard to follow. Given their central role in the financial decision-making process, it’s critical that these models are built to the highest possible standards. Implementing some detailed financial modeling guidelines is a logical step toward improving the financial tools we use every day.
These guidelines will resonate with individuals building their own models, as well as corporations and other organizations. Larger institutions may welcome more consistency and standardization in the models they use across their teams, mitigating the risk of human error. While not every suggestion in the guidelines will be appropriate for every user or organization, they can serve as catalysts to stimulate important discussions.
Download CFI’s free financial modeling guide to advance your finance knowledge and perform better financial analysis.
Get your free download for a deeper dive and how-to guides on the topics listed below, plus much more:
One of the first topics covered in the guide is the importance of thoughtful model design. Time invested upfront in the model design process will save considerable effort on the model build and will lead to a better financial model. An example of a well-designed model dashboard is shown below:
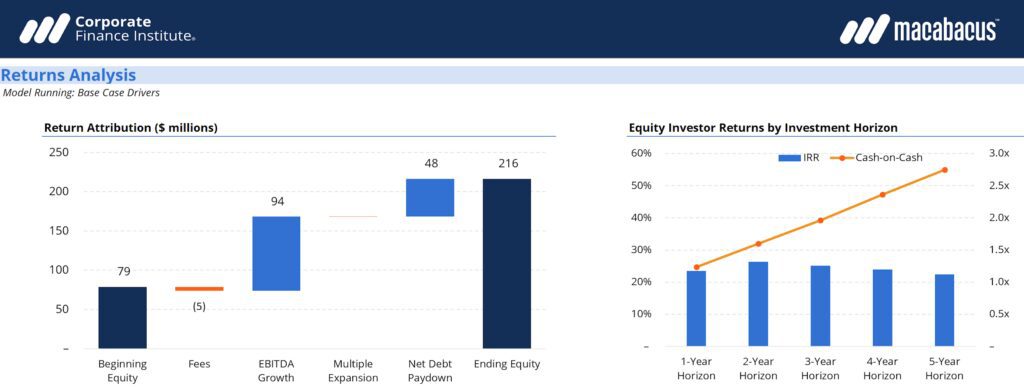
Image: CFI’s Financial Modeling Courses
We also discuss designing in a modular fashion. Using a modular process enables us to create a library of building blocks for future use in other financial models. Dividing the model into these small modules or blocks makes it easier to interpret, print, and present once completed.

Image: CFI’s Financial Modeling Courses
We begin the model design process with the model dashboard or outputs, and then solve back through the supporting schedules to the required inputs as illustrated below. By only including the components that support the dashboard, we ensure the level of detail throughout the model is appropriate to its end objective. This is incredibly important, as many models miss the mark in terms of the appropriate level of detail. Financial models are commonly either too simplistic or overly complex.

Once it’s clear what the model needs to do, we need to imagine how it will be presented. Essentially, we start the process by designing what we refer to as the dashboard of the model. The dashboard is a page or set of pages that shows the audience important model variables. These can include important outputs, but sometimes also critical inputs. Envisioning the final dashboard helps us back-solve the elements that will be included in it.
Periodicity refers to the frequency of the time intervals in the model. Many professionals wonder what model is best: monthly, quarterly, or annual. They may also struggle with the best design. For instance, many models display quarterly information across four columns, with an annual total in the fifth column. Although this is quite common, the downloadable Financial Modeling Guidelines suggest a much better approach to building quarterly models.
Within model schedules, there are a few common structures that work really well and should be used as standard practice. One of the most common structures is a corkscrew, which is especially useful for tracking accounts that change over time. Corkscrews are used extensively in debt and equity schedules.
Circularity is a very controversial topic in the modeling community. Many practitioners build models using the most common circular loops, while others don’t include circularity at all. Download the guide for our view on it as well as some tips regarding model circularity.
Formatting is critically important for a number of reasons. One of the primary ways we can instill confidence in a model is by using a well-structured, clean, and professional format. For example, we can define the ways Excel displays positives, negatives, zeroes, and text. Understanding how to control each individual type of entry in Excel can give you solid control over your formatting.
Your free download includes comprehensive coverage of all of the above, as well as:
Connect what you just learned to a clear career path with CFI’s role‑based courses and certification programs.


