Piotroski F Score Calculator
Download our free Piotroski F score calculator
Piotroski F Score Calculator
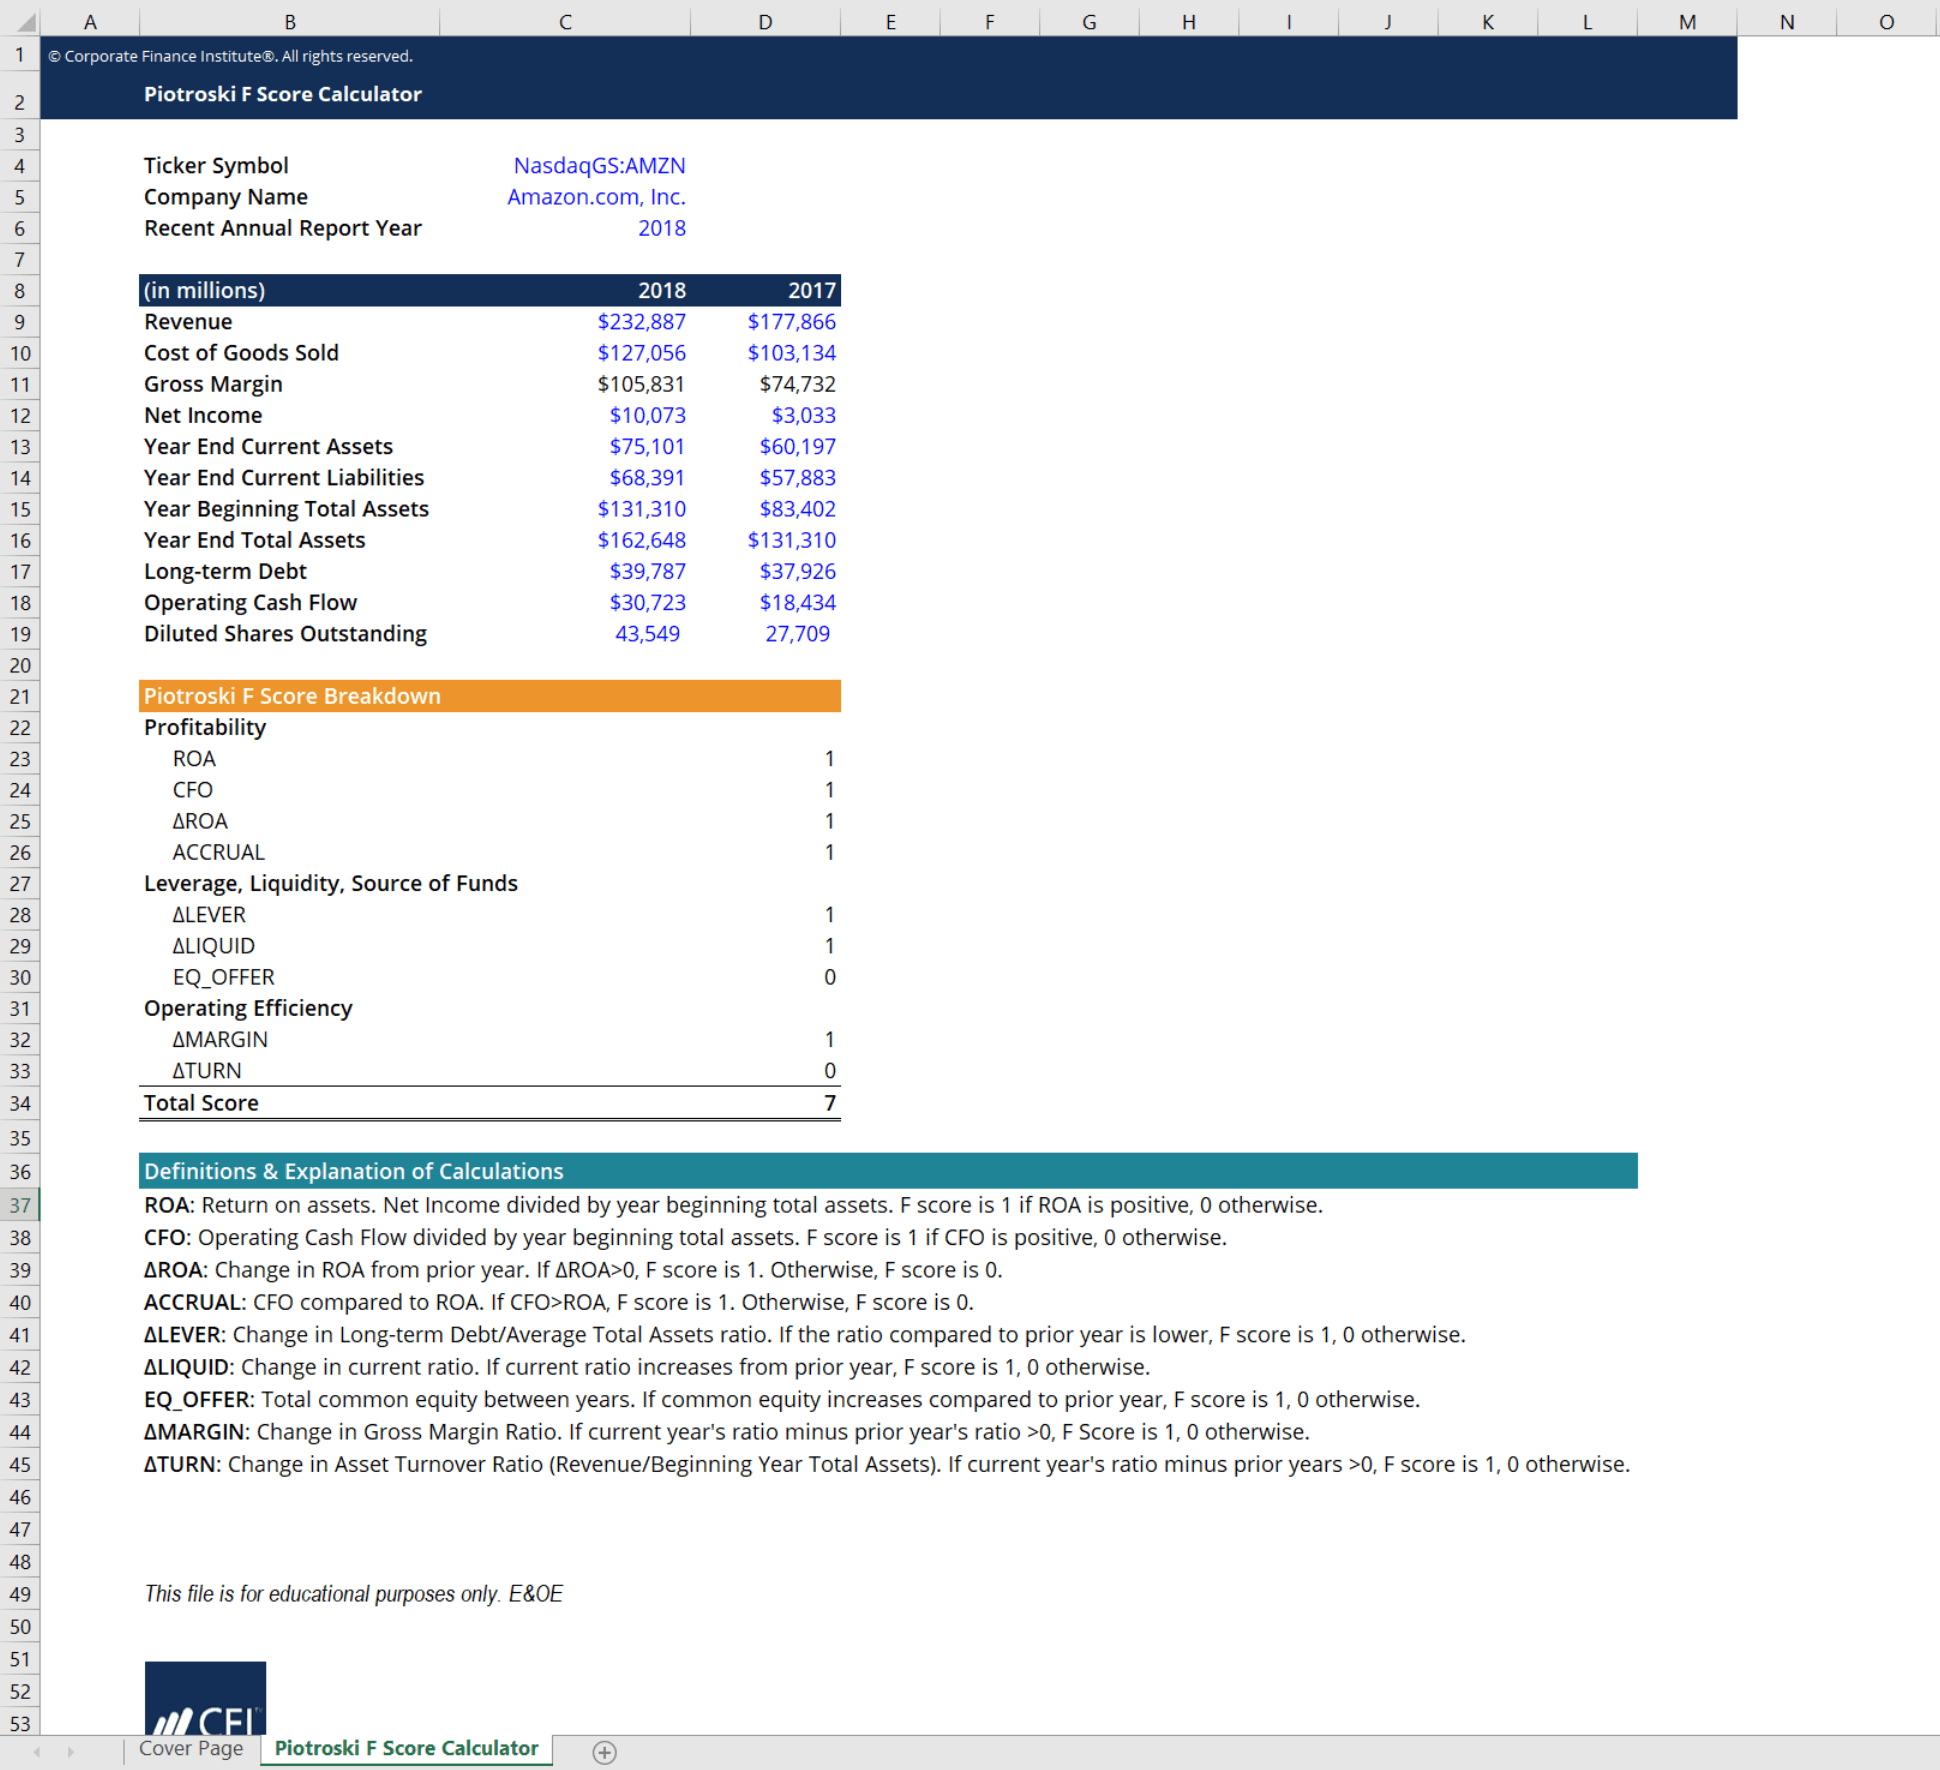
This Piotroski F score calculator will help you assess the strength of a company’s financial state. The Piotroski F score uses nine factors taken from a firm’s financial statements. Using these factors, it calculates a measure of the strength of a firm’s financial position.
Here is a quick preview of CFI’s Piotroski F score calculator:
Download the Free Template
Piotroski F Score Calculator
Download CFI’s Excel template to advance your finance knowledge and perform better financial analysis.
Piotroski F Score Factors
CFI’s Piotroski F score calculator can be used to assess a company’s financial strength by looking at nine factors. A score of either 0 or 1 is rewarded for each of these factors, depending on whether it has been fulfilled or not. The higher the score, the more reliable a stock is to invest in. These factors are categorized into three different sources of financial strength that analysts like to look at.
Profitability
ROA: Return on assets. Net Income divided by year beginning total assets. F score is 1 if ROA is positive, 0 otherwise.
CFO: Operating cash flow divided by year beginning total assets. F score is 1 if CFO is positive, 0 otherwise.
∆ROA: Change in ROA from the prior year. If ∆ROA > 0, F score is 1. Otherwise, F score is 0.
ACCRUAL: CFO compared to ROA. If CFO > ROA, F score is 1. Otherwise, F score is 0.
Leverage, Liquidity, and Source of Funds
∆LEVER: Change in long-term debt/average total assets ratio. If the ratio compared to the prior year is lower, F score is 1, 0 otherwise.
∆LIQUID: Change in current ratio. If the current ratio increases from the prior year, F score is 1, 0 otherwise.
EQ_OFFER: Total common equity between years. If common equity increases compared to prior year, F score is 1, 0 otherwise.
Operating Efficiency
∆MARGIN: Change in gross margin ratio. If the current year’s ratio minus prior year’s ratio > 0, F Score is 1, 0 otherwise.
∆TURN: Change in asset turnover ratio (revenue/beginning year total assets). If current year’s ratio minus prior years > 0, F score is 1, 0 otherwise.
CFI’s Piotroski F score calculator uses all of these factors to evaluate a company. Check out our template to conduct your own analysis on a company’s financial status!
More Free Templates
For more resources, check out our business templates library to download numerous free Excel modeling, PowerPoint presentation, and Word document templates.
Analyst Certification FMVA® Program
Below is a break down of subject weightings in the FMVA® financial analyst program. As you can see there is a heavy focus on financial modeling, finance, Excel, business valuation, budgeting/forecasting, PowerPoint presentations, accounting and business strategy.

A well rounded financial analyst possesses all of the above skills!
Additional Questions & Answers
CFI is the global institution behind the financial modeling and valuation analyst FMVA® Designation. CFI is on a mission to enable anyone to be a great financial analyst and have a great career path. In order to help you advance your career, CFI has compiled many resources to assist you along the path.
In order to become a great financial analyst, here are some more questions and answers for you to discover:
- What is Financial Modeling?
- How Do You Build a DCF Model?
- What is Sensitivity Analysis?
- How Do You Value a Business?
Excel Tutorial
To master the art of Excel, check out CFI’s Excel Crash Course, which teaches you how to become an Excel power user. Learn the most important formulas, functions, and shortcuts to become confident in your financial analysis.

Launch CFI’s Excel Crash Course now to take your career to the next level and move up the ladder!
Accounting Crash Courses
To master the art of Excel, check out CFI’s Excel Crash Course, which teaches you how to become an Excel power user. Learn the most important formulas, functions, and shortcuts to become confident in your financial analysis.
Boost your confidence and master accounting skills effortlessly with CFI’s expert-led courses! Choose CFI for unparalleled industry expertise and hands-on learning that prepares you for real-world success.


