Get Certified for Financial Modeling (FMVA)®
Gain in-demand industry knowledge and hands-on practice that will help you stand out from the competition and become a world-class financial analyst.
Comparing the two growth valuation models
In valuation, we can find useful insights by comparing theories embedded in different valuation models at our disposal. In preparing a valuation model, however, an important insight becomes apparent. When we are attempting to forecast the future cash flows of a company, a trade-off exists between the complexity of our assumptions and the reliability of our estimates. The more complex and sophisticated our assumptions are, the more moving pieces are utilized to arrive at our estimates.
When there are more moving pieces embedded into our assumptions, the less reliable our estimates become. It is because nothing is guaranteed in the future, and the more estimates we use, the probability of false positives increases.

Starting with the most basic components of valuation allows us to become more prudent investors by allowing us to select assumptions that matter the most to us and those that we are most confident in.
In general, the assumptions that investors can be more confident in are those that the company’s stated publicly, those that research analysts make to form a consensus and those that remain relatively consistent over time. These assumptions are related to a company’s non-cash charges and its reinvestment policy. The assumptions that investors, in general, are less confident in, but those which carry the heaviest impact on a company’s valuation is the rate at which we expect the company to grow.
The following models seek to illustrate the impact of these assumptions on the company’s valuation, for us to identify the theoretical insights that are most useful to us in practice.
Download CFI’s Excel template to advance your finance knowledge and perform better financial analysis
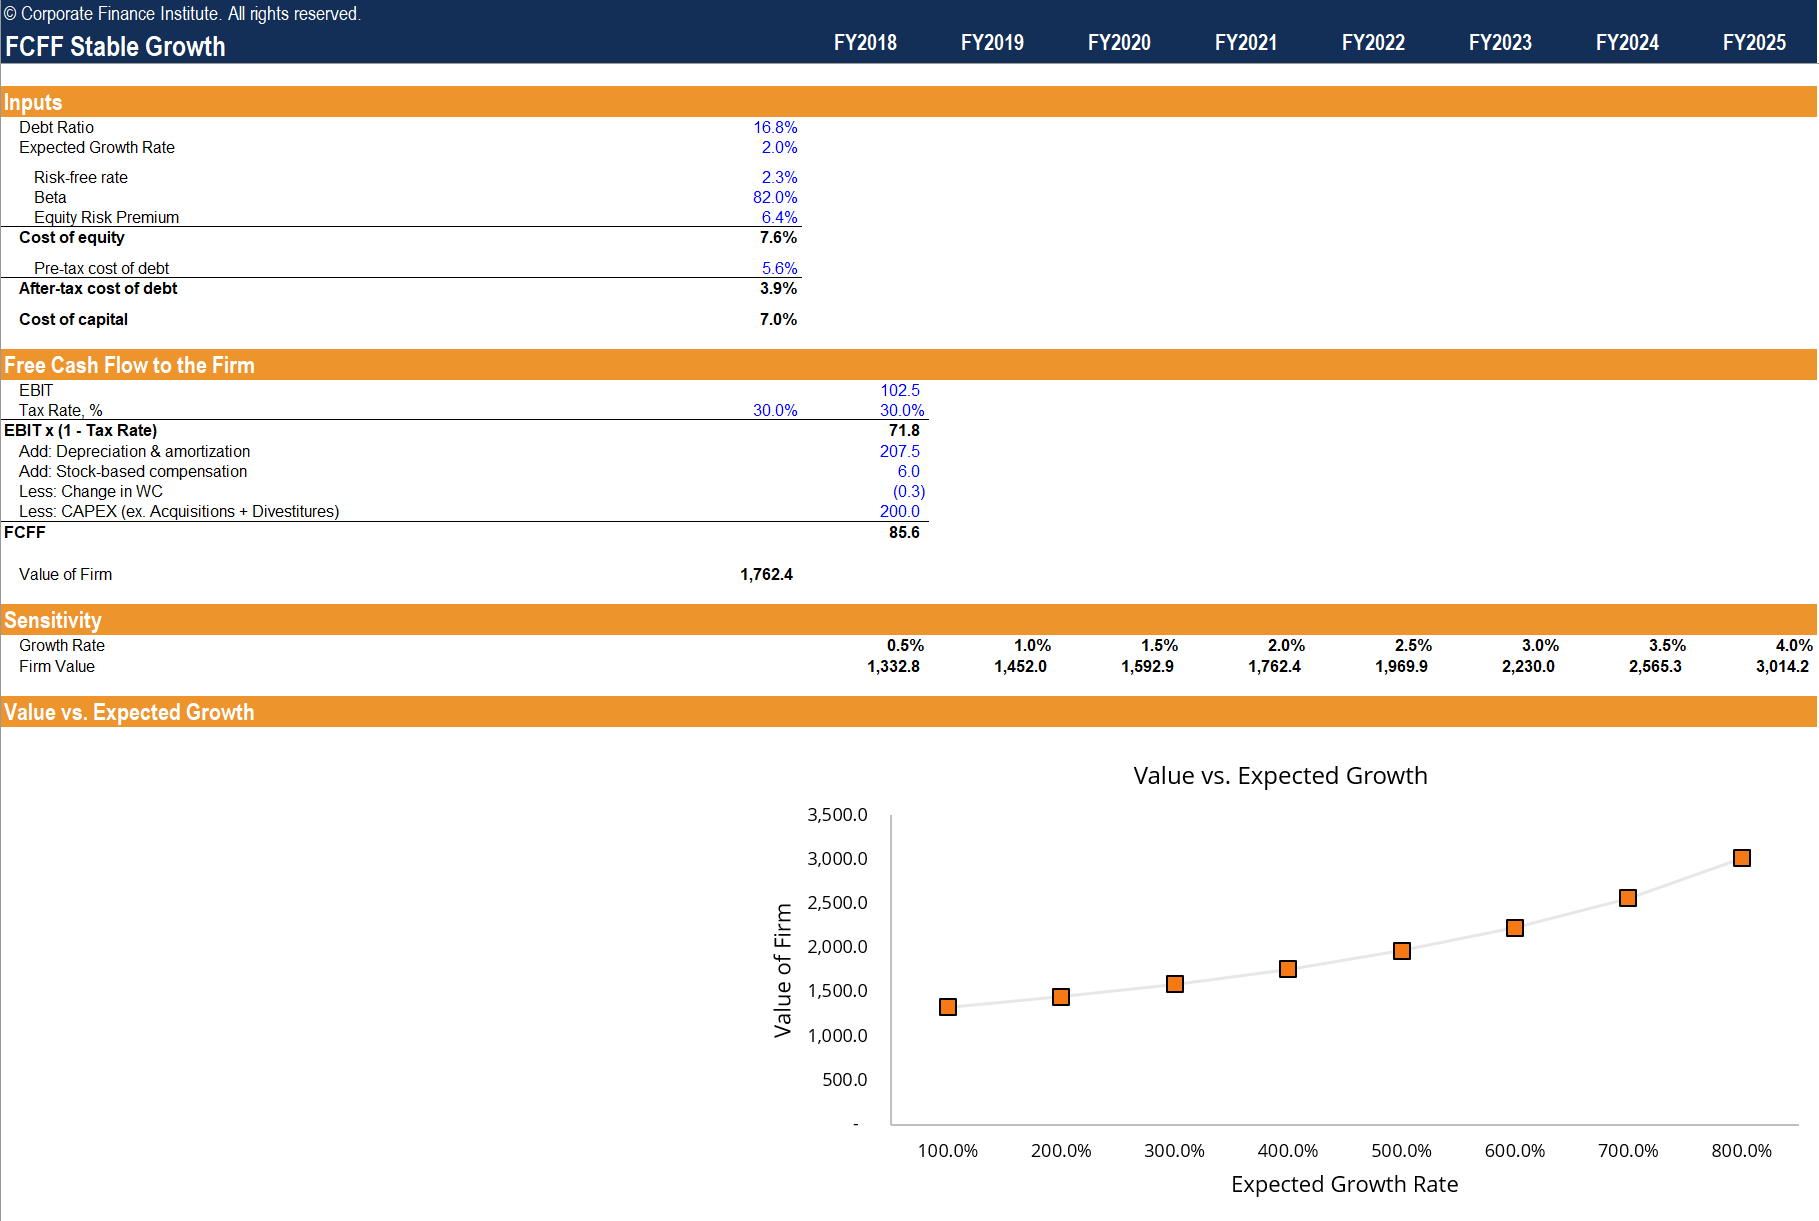
Previously, in this series, we examined the fundamental differences between FCFF and FCFE in the cost of capital used in discounting, as well as the treatment of debt. In a stable growth valuation model, we will seek to analyze how simplifying the growth rate assumption impacts the company valuation by isolating its impact on each type of cash flow.
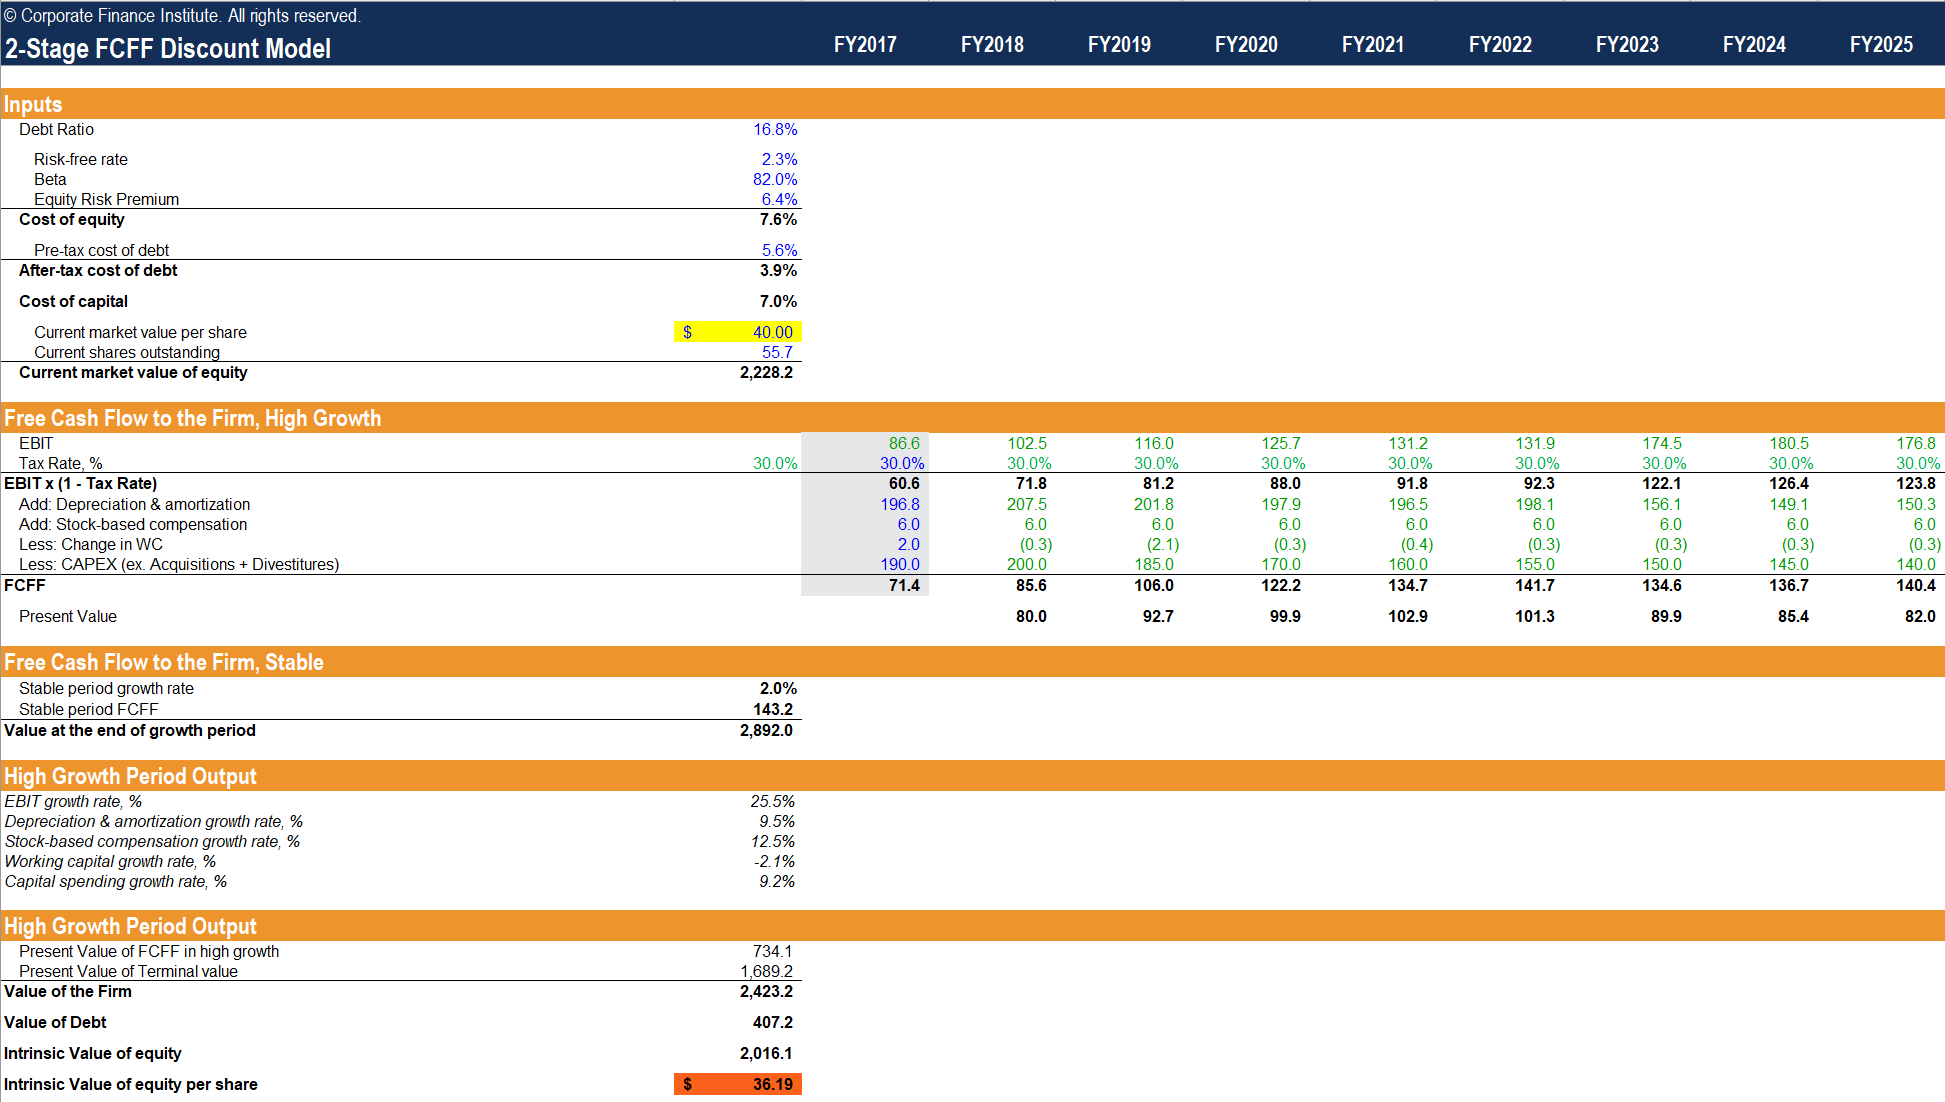
The 2-stage valuation models utilize different growth rates in a presupposed “high growth” period and a “stable” period. This type of valuation model can be used to value companies where the first stage has a finite, unstable/unsustainable growth rate and the second stage has an infinite, stable/sustainable growth rate. Furthermore, we can make the constraining assumption that the growth rate cannot exceed the risk-free rate indefinitely. Intuitively, if we think about the risk-free rate as a proxy for the growth rate of the economy, then any growth rate that perpetually exceeds this implies an unrealistic expectation that the firm will eventually overtake the economy in size.
The dividend discount model utilizes a weighted-average method to determine the growth rate expected in the high-growth phase. Using a mix of historical growth rates, consensus estimates and the fundamental sustainable growth rate is a largely arbitrary conjecture, but are nonetheless the most reliable proxies available at our disposal for estimating growth. The 2-stage DDM sums the present values of dividends in the high growth phase and stable growth phase to arrive at the value of the stock. This valuation is broken up into its sum of the parts, which allows us to measure the value of the growth in each phase. In this example, we observe that most of the valuation is attributable to the high growth phase.
The 2-stage FCFF discount model is a familiar one. It is the traditional DCF model that is used in practice by finance professionals across the world. The 2-stage FCFF sums the present values of FCFF in the high growth phase and stable growth phase to arrive at the value of the firm. The 2-stage FCFE sums the present values of FCFE in the high growth phase and stable growth phase to arrive at the value of the firm. The valuation once again uses WACC to discount FCFF and the cost of equity to discount FCFE, and the debt is treated differently in each valuation model.
The stable growth model utilizes the same FCFF and FCFE assumptions as used in the reconciliation worksheet. In the FCFF valuation, we arrive at a more volatile valuation compared to the FCFE valuation as indicated by the steeper slope in the value vs. expected growth graph. This can be explained by the mechanism behind the growing perpetuity formula, where the difference between the cost of capital and the growth rate is used in the denominator. Using a smaller discount rate results in a smaller denominator, subjecting the valuation to larger swings.
The 2-stage discount models take the stable growth models and extend the growth assumptions further. While the 2-stage DDM uses the goal-seek formula to assign an arbitrary growth rate, we can observe the same insights that we gained from the FCFF and FCFE reconciliation in each of the s-stage FCFF and FCFE valuation models by keeping the base input variables constant. But from the stable growth model, we know that the FCFF valuation shows a standard deviation of value greater than that of FCFE.
To master the art of Excel, check out CFI’s Excel Crash Course, which teaches you how to become an Excel power user. Learn the most important formulas, functions, and shortcuts to become confident in your financial analysis.

Launch CFI’s Excel Crash Course now to take your career to the next level and move up the ladder!


