Get Certified for Financial Modeling (FMVA)®
Gain in-demand industry knowledge and hands-on practice that will help you stand out from the competition and become a world-class financial analyst.
A valuation method that smooths out the high growth period over time
The H-model is a quantitative method of valuing a company’s stock price. The model is very similar to the two-stage dividend discount model. However, it differs in that it attempts to smooth out the growth rate over time, rather than abruptly changing from the high growth period to the stable growth period. The H-model assumes that the growth rate will fall linearly towards the terminal growth rate.

The majority of organizations increase or decrease dividends over time, as opposed to shifting rapidly from high yields to stable growth. Thus, the H-model was invented to approximate the value of a company whose dividend growth rate is expected to change over time.
The H-model is used to assess and value a company stock. The model, similar to the dividend discount model, theorizes that the stock is worth the sum of all future dividend payments, discounted to the present value.
One potential problem with the two-stage dividend discount model is that it assumes an initial high growth rate, then an abrupt drop-off in growth to the terminal growth rate when the company reaches stable growth. The H-model, instead, smooths out the growth rate linearly toward the terminal growth rate. It thus provides a more realistic approach in most scenarios for valuing a company’s stock.
The H-model formula consists of two parts. The first component of the formula considers the value of the stock based on the long-term growth rate. It ignores the high growth rate period. The second component of the equation adds the value from the high growth rate period. The formula is then as follows:
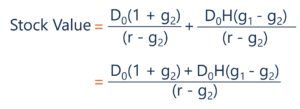
Where:
Visually, we can see how the components of the H-model formula add up to the total value of the stock:
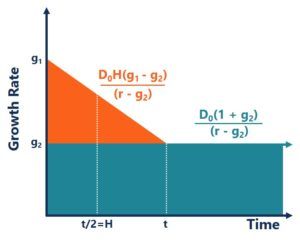
From the initial high growth rate (g1) to the stable growth rate (g2), we can see that under the H-model, the growth rate drops linearly until it hits the terminal growth rate. From there, the terminal growth rate is expected to hold indefinitely. The two components of the H-model formula make up the two parts that are considered in the stock valuation.
Let us now work through a hypothetical situation that involves the H-model. A company recently issued a dividend of $3. The expected growth rate is 10%, and you expect the rate to fall to a stable growth rate of 2% over the next twelve years. If the required rate of return is 11%, what would the value of a share in the hypothetical company be under the H-model?
We are given all the components that are used in the H-model, so, using the formula, we get:
Stock Value = (D0(1+g2))/(r-g2) + (D0*H*(g1-g2))/(r-g2)
Stock Value = ($3(1+0.02))/(0.11–0.02) + ($3*(12/2)*(0.10-0.02))/(0.11–0.02)
Stock Value = $50.00
The calculation above can also easily be done in Excel. The table below shows how Excel was used to calculate the resulting value. To the right of the calculation, the value is sensitized based on the discount rate and terminal growth rate. Below the calculation, the graph shows the growth rate under the H-model:
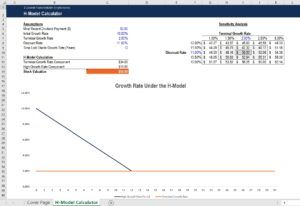
Here, we can see that the component corresponding to the terminal growth rate is $34. The component corresponding to the high growth rate is $16. The two parts combined give a per-share value of $50. To the right of the graph, the value has been sensitized based on the terminal growth rate and the discount rate used.
In the top left corner, we can see that the value could be as low as $42.27 if the discount rate was 12% and the terminal growth rate was 1%. Alternatively, if the discount rate was as low as 10% and the terminal growth rate was 3%, the value of the stock under the H-model would be $62.14.
One of the benefits of using the H-model is the fact that dividends remain steady over a long period. Usually, a company will experience fluctuation in certain measures, such as its total earnings and cash flow.
However, it always tries to ensure that dividends are obtained from the cash flow that it expects to achieve every year. For that reason, most companies never set an unrealistically high dividend target because if they fail to achieve it, that can cause a fall in their share price.
The main unit of measurement used in the H-model is the dividend. The good thing about that is that the definition of a dividend payment is the same for every company. However, the same cannot be said for many other measures. For example, what makes up “total earnings” may differ from one company to another.
The fact that shareholders continue to receive dividends year after year is an indication that the company has reached peak maturity. It shows that its operations are stable, and not much turbulence is likely to be experienced in the future. Thus, from an assessment point, it is much easier to calculate the discount rate since the model eliminates risk.
Thank you for reading CFI’s article on the H-model. CFI offers the Financial Modeling & Valuation Analyst (FMVA)™ certification program for those looking to take their careers to the next level. To keep learning and advancing your career, the following CFI resources will be helpful:


