Transaction Multiples

What you need to know about transaction multiples

What are Transaction Multiples?

Transaction Multiples are a type of financial metrics used to value a company. In an M&A deal, the valuation of a particular company is done by various methods, including discounted cash flow and multiples. Among the different methods, Transaction Multiples play a very different role, as they make the buyer aware of the value of a particular kind of company for investors based on recent trends. It assists in the understanding of multiples and premiums paid in a specific industry.

Calculating transaction multiples takes into consideration several factors, such as the type of premium a company needs to pay to get a controlling stake. This is also one of the reasons why transaction multiples are higher than trading multiples.

Transaction multiples are also known as “Precedent Transaction Analysis.”

Transaction Multiples


Identifying Precedent Transactions:

  • Business Characteristics – The target company’s business should have similar products and services to make them comparable.
  • Financial Outlook – Companies with a similar range of revenue may be more relevant than the ones with a larger or smaller revenue.
  • Time of the Deal – The relevance of the transaction becomes comparable if the transaction is of recent timing.
  • Location of the Target – It also important to consider transactions in the same region as that of the target to make it more comparable to the growth prospects and the challenges faced by a particular region.


Advantages:

  • Information is publicly available.
  • It gives a better understanding of the market with respect to the frequency of transactions regarding different kinds of assets.
  • It helps in the negotiation and discussion of the deal.
  • It provides an understanding of the strategy of different players. Some may seek consolidation, while others may look for small companies and be acquisitive.
  • The range shows the kind of premiums already being paid, and hence is more realistic.


Disadvantages:

  • Every deal is unique, with its own pluses and minuses. No two deals can be compared in an absolute manner.
  • Choosing one transaction over another can lead to sample bias, and hence can give an inaccurate picture.
  • Information available may not be reliable and can be misleading.
  • There may be different synergy benefits to different buyers, so identifying the multiples of Company A may not be relevant for Company C.
  • Market conditions such as economic growth, availability of resources, etc. at the time of precedent transactions may be very different from the current transaction and may provide limited insights.
  • Not all issues can be covered in transaction multiples, including customer contracts, vendor relationships, governance issues, etc., and may not give a true and fair picture.


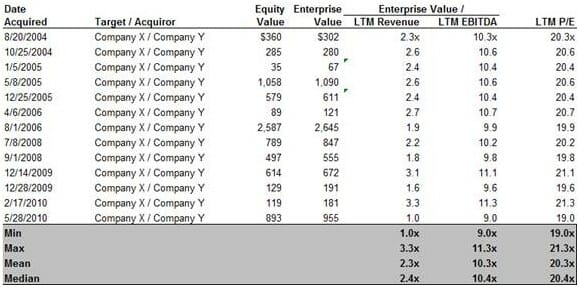
The table below shows a snapshot of transaction multiples for different transactions:


Transaction Multiples


Where to Find about Precedent Transactions

  • Securities Data Corporation (SDC)
  • Equity research reports
  • Annual Reports, 10K, 8K
  • Dealogic / M&A Global
  • Bloomberg
  • Thomson One Banker
  • Capital IQ or FactSet or Merger Market


Analysis of Various Multiples:

  • EV / Revenue – This is one of the most popular multiples used across industries as it is difficult to manipulate revenue figures. This multiple becomes relevant especially when a company has negative EBITDA, as the multiple EV / EBITDA will not be relevant. Start-up companies in the internet, e-commerce sector will generally have negative EBITDA in the initial years. Having said that, EV / Revenue is a poor measure, as two companies with the same revenue can have a large difference in their operations, which reflects in their EBITDA. EV / Revenue is in the range of 1.0x to 3.0x.
  • EV / EBITDA – This is one of the most commonly used multiples and it acts as a proxy for free cash flows. EV / EBITDA is often in the range of 6.0x to 15.0x.
  • EV / EBIT – EBIT is derived after adjustment of depreciation and amortization, as it reflects real expenses and considers wear and tear of a firm’s assets. In the case of non-capital intensive companies, such as consulting or technology companies, EBITDA and EBIT are somewhat close; hence multiples like EV / EBITDA and EV / EBIT are similar. Since EBIT is less than EBITDA, the multiple is higher and is in the range of 10.0x to 20.0x.
  • EV / Capital Employed – This is not one of the popular ways to calculate multiples, but is still used by capital-intensive companies. The invested capital determines the potential earnings, however, it doesn’t take differences in profitability. 
  • P / E – This valuation metric takes into consideration the price in numerator and earnings per share in the denominator. P / E multiple is similar to equity value to net income wherein they are divided by fully diluted shares. This multiple is in the range of 12.0x to 30.0x.
  • PEG Ratio – It is simply the P / E ratio divided by the EPS growth rate and often ranges from 0.5x to 3.5x. The best part of this method is it considers the growth prospects of the company while capturing its growth rate. A company in the growth stage will have more value than a company that has reached the maturity stage.


Other Resources

Thank you for reading CFI’s guide to Transaction Multiples. To keep learning and advancing your career, the following resources will be helpful:

0 search results for ‘