Get Certified for
Capital Markets (CMSA®)
From equities and fixed income to derivatives, the CMSA certification bridges the gap from where you are now to where you want to be — a world-class capital markets analyst.
An index that tracks the new 52-week highs and new 52-week lows between stocks in a prevailing index
A high-low index is an index that tracks the new 52-week highs and new 52-week lows between stocks in a prevailing index. It is used in technical analysis, analysis of charts, and past stock data as an indicator to determine the direction of the market or index – whether the market will go up or down. Additionally, the high-low index is also known as a breadth indicator; it gauges an index’s strength and weakness.

A high-low index is based on the Record High Percent calculation; further, the high-low index is a simple moving average of the Record High Percent to understand the trend of the index. Typically, the simple moving average will be a 10-day moving average of the Record High Percent; however, a longer period could also be used.
An average of the Record High Percent is taken to smoothen out any moments of extreme volatility in the index being analyzed; it is done to obtain a clearer picture of the movements in the index or the market. Often, a high-low index is calculated on indexes that are proxies for the whole market; for example, the S&P 500, NASDAQ 100, Dow Jones Industrial Average (DJIA), or the Russell 2000.
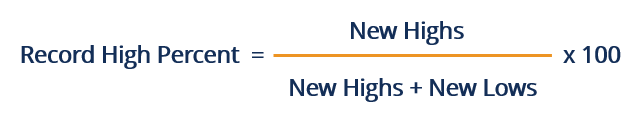
The high-low index is calculated by taking the simple moving average of new 52-week highs and new 52-weeks lows of an underlying index, using the Record High Percent method, over a predetermined period of time. Below is how the Record High Percent is calculated:
After calculating the Record High Percent, a simple moving average of the past 10 days (or another time period) must be computed to calculate the high-low index. A more visible and understandable trend of the underlying index will be obtained by taking the simple moving average.
To obtain the simple moving average of the Record High Percent over a 10-day period, sum the Record High Percent’s from the past 10 days and divide the sum by 10. It should be noted that since the high-low index is a moving average, as each day passes, the furthest back observation is removed from the calculation, and a new, most recent observation is added.
The high-low index is used to interpret whether the underlying index is performing well and in a bullish state or performing poorly and in a bearish state. To determine the relevant scenario, one must look to the high-low index level. Remember, the high-low index is an average of the Record High Percent, which is the percent of new highs to new highs and lows.
Thus, if the high-low index is above 50, it would imply that there are more 52-week record highs than 52-week record lows. If the index is below 50, the opposite holds. Also, for the underlying index to be deemed bullish, the high-low index must consistently be at a level around 70. To be deemed bearish, the index must consistently be at a level around 30.
The high-low index reflects past data as it takes a simple moving average of the new highs and new lows through the Record High Percent and is used as a trading indicator. However, one of the oldest adages in finance and the capital markets is that past returns do not indicate future returns.
A high-low index may be a useful tool to assess the relative strength of the underlying index; however, to be used as a trading indicator that would generate buy or sell signals assumes the market is not weak form efficient and could yield adverse results.
Simple market efficiency theory assumes three levels of market efficiency – strong form efficiency, semi-strong form efficiency, and weak form efficiency, which go from most efficient to least efficient, respectively. Acting exclusively on buy/sell signals from high-low indexes would imply that an investor believes that an index or market is not weak form efficient, which is unlikely.
CFI offers the Capital Markets & Securities Analyst (CMSA)® certification program for those looking to take their careers to the next level. To keep learning and advance your career, the following resources will be helpful:


