Get Certified for
Capital Markets (CMSA®)
From equities and fixed income to derivatives, the CMSA certification bridges the gap from where you are now to where you want to be — a world-class capital markets analyst.
A technical indicator used to identify trends in a market
The Negative Volume Index (NVI) is a technical indicator used to identify trends in a market. It is a cumulative indicator, which means that all changes to the indicator accumulate. Put another way, the values used in the indicator in the current period will be used in future values for the previous period.
The indicator was first developed by American stock market technician Paul Dysart in the 1930s. However, the version of the quantitative version of the indicator used today was developed by stock market econometrician Norman Fosback in 1976. The following sections discuss the intuitive idea behind the indicator, the calculation of the indicator, and a backtest based on a simple NVI strategy.
The idea behind the Negative Value Index (NVI) is that if a trend continues even as trading volume falls, it is a strong trend. The belief here is that high trading volume is a result of uninformative traders.
On the other hand, it is assumed that on low trading volume days, the more informed traders or “smart money” are at play. Hence, the ultimate inference being that if the price continues to rise even on low volume days, it is a strong signal that the upward trend in price will continue.
Below is a simple step-by-step process to calculate the Negative Value Index (NVI).
Step 1: Set the NVI level on the starting date at a round figure. The typical base level is 1,000. Other commonly used levels are 1 and 100.
Step 2: For the following period, if the volume goes up, then the NVI for that period will be the same as that of the previous period
Step 3: If the volume goes down during a given period, then the Negative Volume Index is given by the following formula:
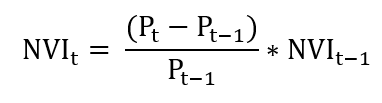
Where:
In the following example, we calculate the NVI indicator for Intel Inc. (INTC) stock from January 2017 to July 2020. The charts below illustrate the calculation of the NVI over the period.
The NVI does not change much during periods of low volatility, as it is a sideways market without a strong trend. On the other hand, during the market downturn of March 2020, there is a spike in the NVI, indicating a change in trend.

The Negative Volume Index (NVI) can be used to create a simple trading strategy. The NVI is used to generate buy signals whenever the NVI crosses above its exponential weighted moving average (EWMA). The most common choice for the EWMA is the 250-day moving average.
The chart below illustrates a buy signal for the INTC stock. The NVI is not a very good sell indicator, and a shorting strategy using the NVI leads to losses. Hence, any strategy using the NVI is a long-position strategy only.

The setup section analyzes a version of the NVI strategy. The target security is the S&P 500 Index, and the strategy is to buy the index whenever the NVI crosses above its 20-day moving average. The stock is sold when the NVI crosses back down, and the position is converted to all cash. There is no shorting or using leverage.
To measure the relative performance of the NVI strategy, it is compared to a simple buy and hold strategy on various metrics listed below:
The analysis period is from January 2017 to July 2020. Hence, historically, the period includes both a bull market of 2017 and the market crash of 2020.
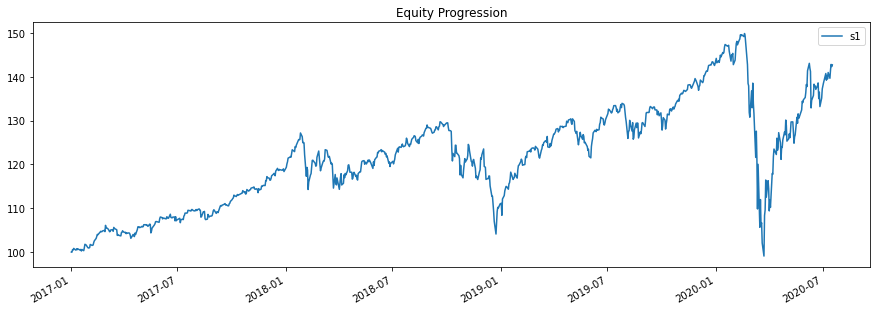
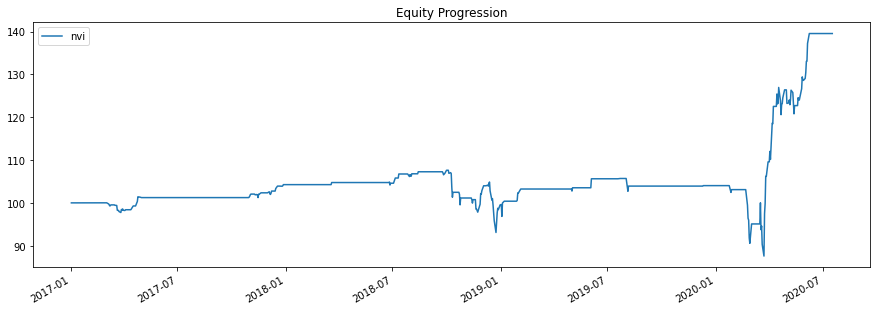
Total Return: The buy-and-hold strategy returns about 40% over the analysis period, whereas the total return on the NVI strategy was around 30%. The charts below plot the equity progression of both strategies starting in January 2017, with the base level set at 100.
Sharpe Ratio: The Sharpe Ratio measures the performance of an investment strategy on a risk-adjusted basis. For the buy and hold strategy, we get an annual Sharpe Ratio of 0.4, whereas, for the NVI strategy, we get an annual Sharpe Ratio of about 0.56. Hence, even though the buy-and-hold strategy offers a higher return, it is much riskier than the NVI strategy.
Max Drawdown: The maximum drawdown for a strategy is the difference in the value of a strategy from its peak to bottom going forward in time. For the buy and hold strategy, the maximum drawdown during the period was -34%. The NVI strategy saw a maximum drawdown of about -19% over the same period.
The following table summarizes the performance metrics for both strategies:
| Buy and Hold | Negative Value Index | |
| Total Return | 40% | 30% |
| Sharpe Ratio | 0.4 | 0.56 |
| Max Drawdown | -34% | -19% |
CFI is the official provider of the global Capital Markets & Securities Analyst (CMSA)® certification program, designed to help anyone become a world-class financial analyst. To keep advancing your career, the additional resources below will be useful:


