Get Certified for
Capital Markets (CMSA®)
From equities and fixed income to derivatives, the CMSA certification bridges the gap from where you are now to where you want to be — a world-class capital markets analyst.
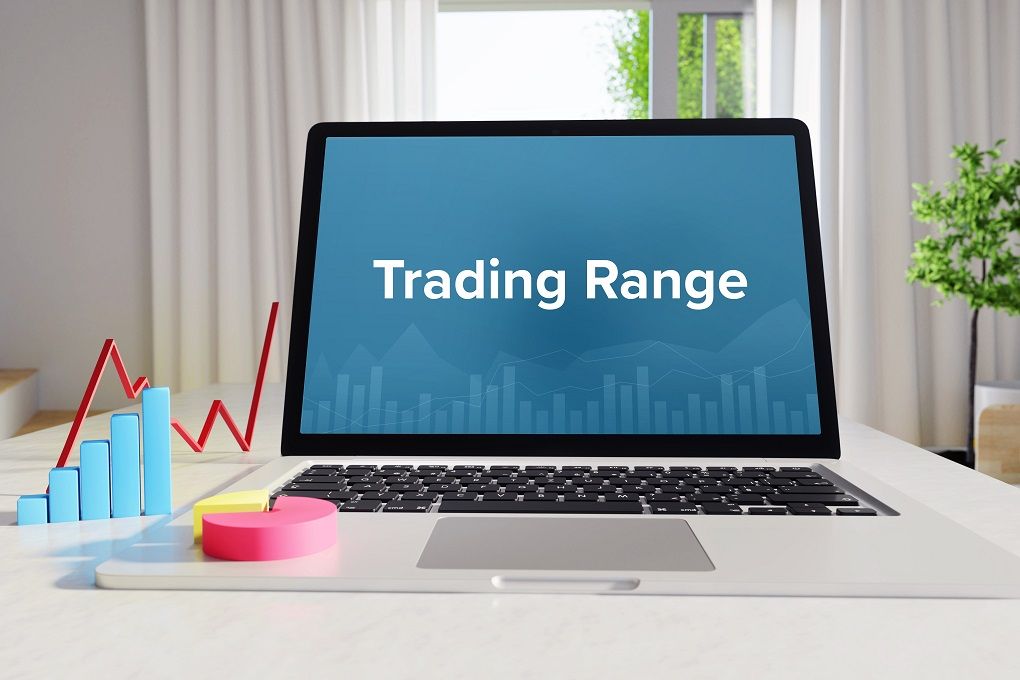
Trading range occurs when price actions consistently bounce between established highs and lows for a certain period
A trading range is the vertical price movements between a resistant ceiling and a support floor for a period of time. Trading range often occurs in all financial markets in which the price resistance is provided by the top of a security’s trading range, while the price support is offered by the bottom of the trading range.
Such horizontal consolidations offer opportunities to traders where they can sell near resistance and buy near support. To some traders, the trading range may signal a breakthrough trading opportunity where a breakout occurs above the ceiling and a breakdown occurs below the support floor.
Price behavior can be construed as a distribution that moves toward or away from its average price over time. The moving average is the most popular method used to establish the market’s average price. Essentially, the slope of the moving average is monitored to confirm the occurrence of a trading range.
The price is more likely to revert toward its average price when it moves above or below its moving average. The idea is to capitalize on the price’s tendency to return to the mean.
Several factors influence the prices of securities, such as the type of security and the sector where the security operates. For example, tradable instruments with fixed income demonstrate a smaller trading range than commodities and equities with high price volatility.
Investors who intend to profit from range-bound trading go for instruments with lower volatility since higher volatility indicates turmoil in the market. A high price serves as a major resistance level in a range-bound market, which can be considered a ceiling for price action and cannot be broken.
Similarly, low price acts as a major support level, which can be considered a floor for price action. Still, both the high price and low price can be broken. To use a range-bound trading strategy, a trader must first identify the market conditions, which entails major support and resistance levels, using various technical analysis approaches.
Traders can avoid false bounces or breaks by adopting various methods, such as trade filters or trade triggers, to enter a trading range. There are various range-bound trading strategies, including key technical tools such as Bollinger Bands, oscillators, and moving averages, among others.
With Bollinger Bands, the slope of the moving average that runs through the middle of the bands can be monitored to determine if the market is range-bound. A flat or almost flat slope indicates potential trading.
On the other hand, oscillators are used to determine the range of trading by confirming turns or resistance near or at support and resistance. If the oscillator line(s) crosses the oversold boundary, a potential long trade is in the offering. Conversely, if the oscillator line crosses the overbought boundary, a potential short trade is near.
To correctly interpret price charts and trade successfully, traders must identify and measure the support and resistance’s strength. A downtrend can be interrupted or reversed at the support level where the buying is strong. Horizontal or near-horizontal lines connecting several bottoms are used to represent support.
Also, a downtrend can be interrupted or reversed at the resistance level where selling is strong. Horizontal or near-horizontal lines connecting several tops are used to represent resistance.
Factors such as height, length, and trading volume at a specific zone determine the strength of support and resistance of regions. Therefore, a security in a range-bound market can either be bought when the price approaches a support level or be sold when the price reaches a resistance level.

A breakout from a trading range can also offer traders an opportunity to enter a range-bound market. Traders would need to confirm the entry using indicators such as price or volume action.
For example, there should be an increase in volume outside the trading range on the initial breakout. Traders may choose to wait for a retracement before entering the market rather than going after the price.
Range trading seeks to exploit the price action between the support and resistance levels. After identifying favorable market conditions, a trader can purchase a security near or at the overbought zone and sell near or at the oversold level.
Long-term success in a trading range would require a trader to enter the market where the stop loss is lower and the profit target is higher. The strategy can work well in a trending financial market.
CFI is the official provider of the Capital Markets & Securities Analyst (CMSA)® certification program, designed to transform anyone into a world-class financial analyst.
To keep learning and developing your knowledge of financial analysis, we highly recommend the additional resources below:


