Undervalued

An investment that can be purchased for less than its intrinsic value

Over 1.8 million professionals use CFI to learn accounting, financial analysis, modeling and more. Start with a free account to explore 20+ always-free courses and hundreds of finance templates and cheat sheets.

What Does Undervalued Mean?

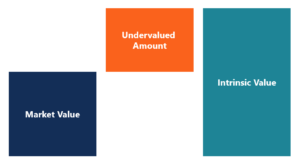
An undervalued asset is an investment that can be purchased for less than its intrinsic value. For example, if a company has an intrinsic value of $11 per share but can be purchased for $8 per share, it is considered undervalued.

Undervalued

Intrinsic Value

An investment is either overvalued or undervalued relative to its intrinsic value. Since an asset’s intrinsic value is subjective, it means that being over/undervalued is also subjective.

Simply put, the intrinsic value of an asset is the price a rational investor would be willing to pay for the asset. It is most commonly the Net Present Value (NPV) of all future cash flows the asset will generate. For a refresher on the topic, see CFI’s guide to valuation methods, as well as financial modeling, and more specifically, DCF models.

Undervalued vs. Overvalued

If the value of an asset trades at its intrinsic value, it is said to be fairly valued (plus or minus a reasonable margin). When an asset moves significantly off that value, it then becomes under/overvalued.

Value Investing

Investors who purchase stocks that are below their intrinsic value are called “value investors” or investors who like “cheap” stocks. While value investing may be a good idea, one issue can involve falling for a “value trap,” which is a low-quality company that seems cheap but isn’t actually worth anything more than its market price.

Ratios for Undervalued Investments

Investors can use several methods to find investments (typically stocks) that are worth more than the price they have to pay for them. Below are examples of some of the most commonly used ratios for assessing whether a stock is overvalued or undervalued:

Price/Net Present Value (P/NPV)

Price/NPV is the best (i.e., most complete) method for valuing a company. To perform the Price/NPV analysis, a financial analyst must build a financial model to forecast the company’s revenues, expenses, and cash flows into the future and calculate the Net Present Value (NPV). The analyst will then compare the value from the Discounted Cash Flow (DCF) model to the market price of the investment. To learn more, check out CFI’s free financial modeling guide.

Other Ratios

If an analyst doesn’t have access to enough information (or time) to build a financial model, they may turn to other ratios to assess a company’s value. Other common ratios include:

  1. Price/Earnings (PE) Ratio
  2. Price/Book (PB) Ratio
  3. EV/EBITDA Ratio
  4. EV/Revenue Ratio
  5. Price/Cash Flow (P/CF) Ratio
  6. Dividend Yield and Payout Ratio

When using the above ratios, it’s important to pay careful attention to avoid “value traps” as discussed above. Since companies can temporarily have fluctuations in their financial statements, the above ratios may appear more favorable or unfavorable than they would be over the long run.

A company may incur one-time expenses on their income statement or include impairment of assets on the balance sheet, but they don’t necessarily reflect the ongoing expected performance of the business.

Long vs. Short Strategies

When a stock is undervalued, it presents an opportunity to go “long” by purchasing its shares. When a stock is overvalued, it presents an opportunity to go “short” by selling its shares. Hedge funds and sophisticated investors may use a combination of long and short positions to bet on over/undervalued stocks. To learn more, check out CFI’s trading guides.

Additional Resources

CFI is the official provider of the global Financial Modeling & Valuation Analyst (FMVA)™ certification program, designed to help anyone become a world-class financial analyst. To keep advancing your career, the additional resources below will be useful:

0 search results for ‘