Get Certified for Financial Modeling (FMVA)®
Gain in-demand industry knowledge and hands-on practice that will help you stand out from the competition and become a world-class financial analyst.
P&L statement or income statement? This is a common question from individuals new to finance. In most cases, “P&L” and “income statement” mean the same thing: a report showing a company’s revenues, expenses, and profit or loss over a specific period.
Using the terms interchangeably is generally acceptable, although a small but important nuance does exist:
This guide covers what’s in a P&L/income statement, who uses it, and how it connects with other key financial statements to reveal a company’s financial health.
Now that you know what the terms mean, let’s take a closer look at what’s actually inside a typical income statement — and why each part matters.
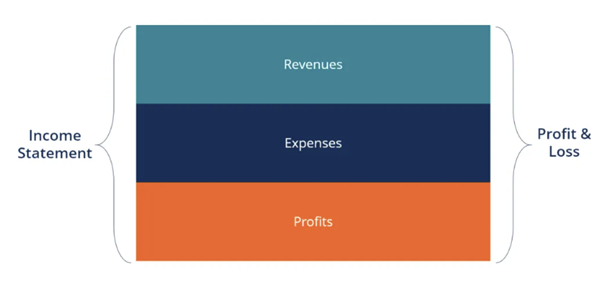
Beyond just tracking revenues and expenses, an income statement (or P&L) captures the full story of a company’s profitability over time. Whether you call it a P&L or an income statement, think of it as your organization’s report card for a quarter or year. It tells a story about how the business performed along the way to a profit or loss.
Depending on the organization, you might also hear it referred to as an “earnings statement” or “statement of operations.”
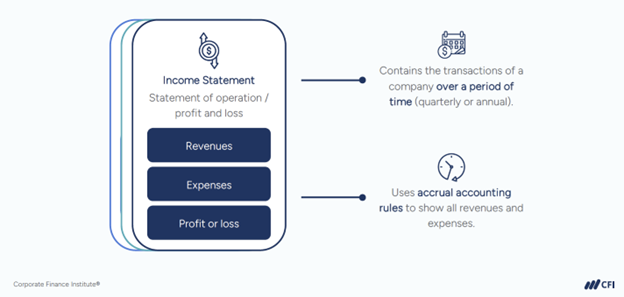
Here’s a breakdown of the key sections you’ll typically find on an income statement and what each one reveals about a company’s performance.
Remember that income statements provide only one perspective on a company’s financial health, but it doesn’t tell the whole story. For a comprehensive view, always analyze the balance sheet and cash flow statement alongside the income statement.
Here’s a real-world example to see these concepts in action.
Amazon’s 2024 income statement (which Amazon formally titles ‘Consolidated Statement of Operations’) is provided below. Notice how they’ve organized their revenues and expenses. Pay special attention to the dramatic improvement in their net income from 2022 to 2024.
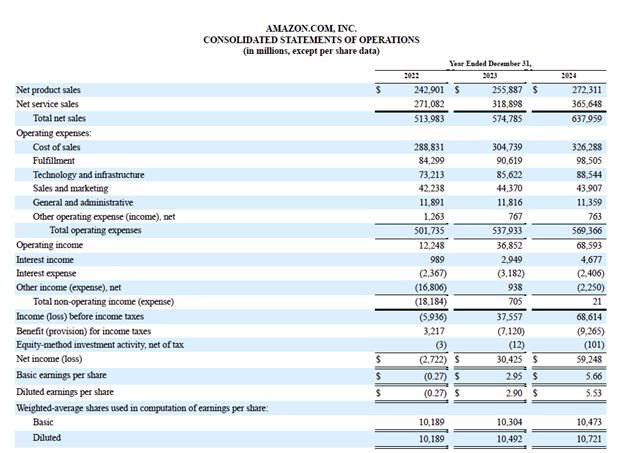
Amazon posted a net loss of $2.7 billion in 2022, then net income of $30.4 billion in 2023 and $59.2 billion in 2024.
Amazon’s income statement breaks down as follows:
Finance professionals rely on income statements for different reasons depending on their role and goals. Your CFO might be focused on one aspect, while your investors care about something else entirely.
Here’s a quick look at who uses these statements and what they’re looking for:
| Accountants and Controllers | Prepare accurate financial statements and ensure compliance. | |
| FP&A Professionals | Build financial models and forecasts, lead planning and budgeting, and monitor financial metrics. | |
| Auditors and Regulators | Verify financial statements comply with GAAP or IFRS standards. | |
| Investors and Analysts | Analyze profitability, forecast earnings, and estimate valuation. | |
| Banks and Lenders | Evaluate credit risk and estimate repayment ability. |
Whether it’s a CFO, investor, or analyst, the goal is the same: to extract insights from the numbers. Next, let’s look at how professionals break down an income statement to find the story behind the figures.
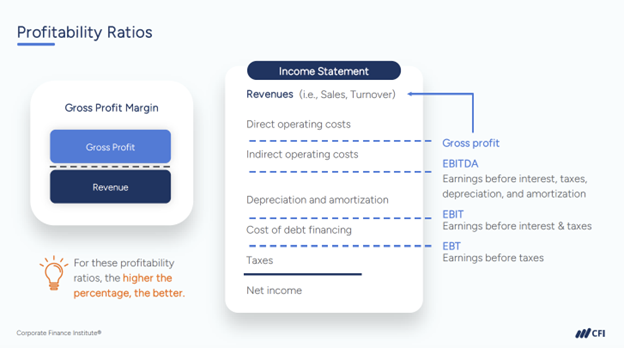
A deep analysis of an income statement surfaces patterns in growth, operational efficiency, and profitability. This gives you a clearer view of a company’s financial momentum.
Financial analysts use the following core techniques to dig deeper:
Analyzing an income statement the right way helps you see where a company has been and where it might be headed.
Ready to analyze financial statements like a pro? Build practical skills with CFI’s Financial Analysis Fundamentals course and start turning numbers into real business insights.
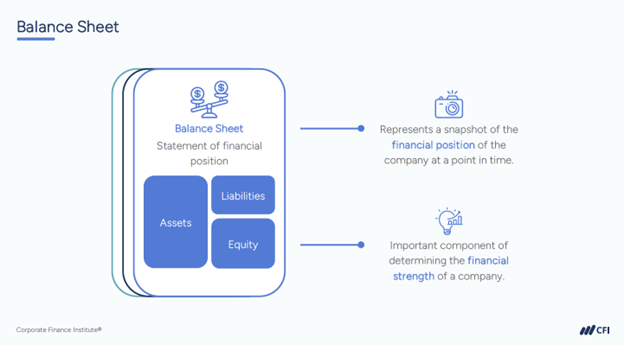
To truly understand a company’s financial health, you need to examine how the income statement connects with the balance sheet and cash flow statement.
The balance sheet shows what a company owns, what it owes, and how it finances its operations at a specific point in time. It’s based on the core accounting equation:
Assets = Liabilities + Shareholders’ Equity
The cash flow statement tracks the money moving into and out of the business, broken into three categories:
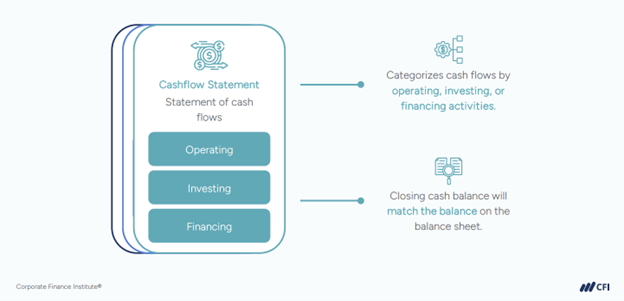
The income statement, balance sheet, and cash flow statement each reveal a different side of a company’s finances. Together, they give you a complete view of business performance, risk, and financial strength.
Whether you hear “P&L” or “income statement,” the meaning is the same: a profitability report that tells a company’s financial story. What matters most is knowing how to read it, spot key insights, and connect it to the balance sheet and cash flow statement for a full view of a company’s financial health.
If you want to build these analysis skills, CFI’s Financial Analysis Fundamentals course is the perfect place to start. It’s also part of our Financial Modeling & Valuation Analyst (FMVA®) Certification, designed to equip you with the practical skills analysts need to stand out.
Ready to sharpen your analysis skills and accelerate your career?
Learn to build advanced financial models, perform valuations, and deliver insights that drive decisions. Learn at your own pace through structured courses and hands-on practice, as well as earn an industry-recognized credential.
Strengthen your skills, build real-world expertise, and take the next step toward advancing your career.


