Get Certified for Financial Modeling (FMVA)®
Gain in-demand industry knowledge and hands-on practice that will help you stand out from the competition and become a world-class financial analyst.
The proportional analysis of financial data
Vertical analysis is an accounting tool that enables proportional analysis of documents, such as financial statements. While performing a vertical analysis, every line item on a financial statement is entered as a percentage of another item. For example, on an income statement, every line item is stated in terms of the percentage of gross sales.

Similarly, in a balance sheet, every entry is made not in terms of absolute currency but as a percentage of the total assets. Performing a vertical analysis of a company’s cash flow statement represents every cash outflow or inflow relative to its total cash inflows.
Vertical analysis is most commonly used within a financial statement for a single reporting period, e.g., quarterly. It is done so that accountants can ascertain the relative proportions of the balances of each account.
Vertical analysis is exceptionally useful while charting a regression analysis or a ratio trend analysis. It enables the accountant to see relative changes in company accounts over a given period of time. The analysis is especially convenient to do so on a comparative basis.
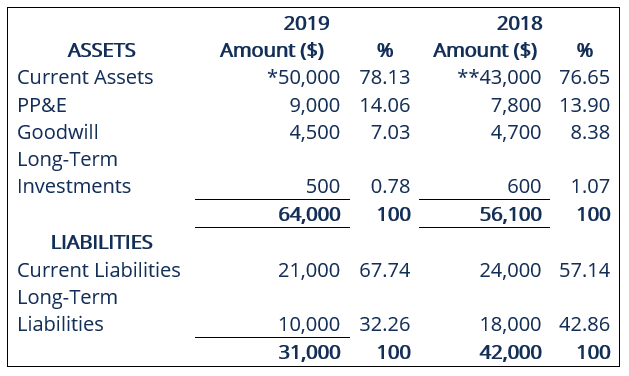
*2019: ($50,000 / $64,000) × 100 = 78.13%
**2018: ($43,000 / $56,100) × 100 = 76.65%
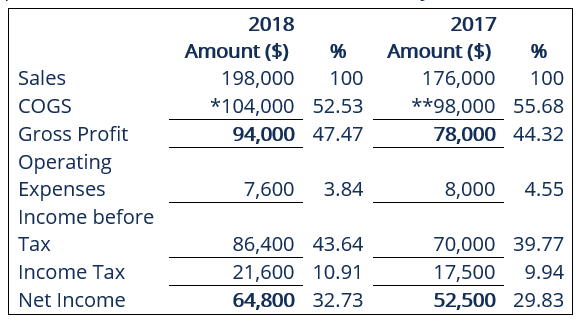
*2018: ($104,000 / $198,000) × 100 = 52.53%
**2017: ($98,000 / $176,000) × 100 = 55.68%
Connect what you just learned to a clear career path with CFI’s role‑based courses and certification programs.
Thank you for reading CFI’s guide to Vertical Analysis. To keep learning and advancing your career, the following resources will be helpful:


