Get Certified for
Business Intelligence (BIDA®)
Develop analytical superpowers by learning how to use programming and data analytics tools such as VBA, Python, Tableau, Power BI, Power Query, and more.
A financial metric to evaluate the performance of existing retail stores
Same-store sales, also known as comparable-store sales, is a financial metric commonly used by companies in the retail industry to evaluate the performance of existing stores.

To understand why the same-store sales metric is disclosed, consider the following example:
Although the company’s revenues increased year-over-year, the company added new stores. A significant question by analysts would be: “Is the increase in revenues due to existing stores or new stores?”
Therefore, the same-store sales metric is used to provide readers of financial statements with greater information. By providing the same-store sales metric, analysts can determine how well existing locations are performing.
In fact, investors and analysts often keep a close eye on same-store sales due to it being a strong predictor of the health of retail operations and future success of a company. For analysts, same-store sales for retail companies often holds as much importance as the revenue and earnings numbers.

Where:
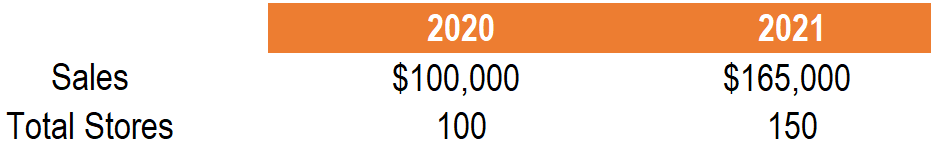
An analyst is looking to determine the same-store sales for a company. The analyst noted that the company operated 100 stores that generated total sales of $100,000 in 2020. In 2021, the company added 50 new stores, with management noting that each store contributed $1,100 in sales for a total sale of $165,000. The information is illustrated below:
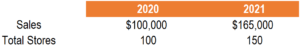
What is the same-store sales number for the company?
In 2020, the 100 stores generated sales of $100,000. In 2021, each store generated sales of $1,000. Using the same number of stores in 2020, the total sales amount to $110,000 in 2021 for the same stores. Therefore, same-store sales are calculated as:
Same-store sales = ($110,000 / $100,000 – 1) x 100 = 10%
A positive (>0%) same-store sales figure is favorable, while a decrease (<0%) in same-store sales is detrimental. A positive same-store sales figure means that the company generated more sales per store compared to last year – an indicator of growing customer demand. On the other hand, a negative same-store sales figure means that the company generated fewer sales per store – an indicator of deteriorating customer demand.
However, this is not to say that a positive same-store sale is always favorable. The metric must be compared to an expectation. As we will see in the example below, a positive same-store sales figure does not necessarily translate to a strong-performing company.
On July 16, 2019, Domino’s Pizza reported its quarterly earnings. Among other things, the company reported same-store sales of 2.1% for US stores, 3.1% for US franchise stores, and 2.4% for international stores. The company’s same-store sales were below analyst expectations. As a result, shares of Domino’s plummeted after its earnings announcement.
As shown in the example above, although Domino’s Pizza reported positive same-store sales, that alone does not necessarily indicate that the company is doing well. The ratio must be compared to a benchmark or analyst expectations. If analysts expect same-store sales for a company to increase 15%, but the company only delivered 5%, it would indicate a weak-performing company.
Thank you for reading CFI’s guide to Same-Store Sales. To keep learning and developing your knowledge base, please explore the additional relevant CFI resources below:
Below is a break down of subject weightings in the FMVA® financial analyst program. As you can see there is a heavy focus on financial modeling, finance, Excel, business valuation, budgeting/forecasting, PowerPoint presentations, accounting and business strategy.

A well rounded financial analyst possesses all of the above skills!
CFI is the global institution behind the financial modeling and valuation analyst FMVA® Designation. CFI is on a mission to enable anyone to be a great financial analyst and have a great career path. In order to help you advance your career, CFI has compiled many resources to assist you along the path.
In order to become a great financial analyst, here are some more questions and answers for you to discover:


