Get Certified for
Capital Markets (CMSA®)
From equities and fixed income to derivatives, the CMSA certification bridges the gap from where you are now to where you want to be — a world-class capital markets analyst.
A pattern in asset prices that creates a W-shaped movement
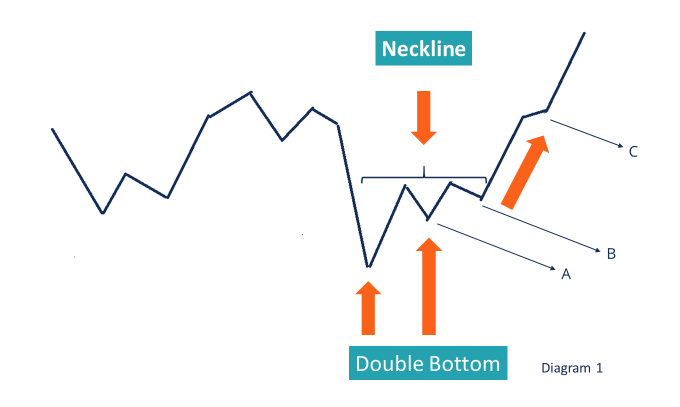
A double bottom is a type of price movement identified in technical analysis where there is a fall in price led by gain and then another drop (similar to the previous drop), and finally, a rise in price from a shape that is similar to the letter W. An accurate definition of a double pattern is achieved when the second price rise goes above the highest point, thus ending the pattern.
Usually, the first drop is usually a sharp decline, while the second drop is more of a gradual drop. The first drop is because of panic selling by investors, while in the second drop, investors who bought stocks after the first drop sell to gain profits.
A double bottom is an indicator of positive signals as the stock’s reached its low, and the second bottom will mostly be followed by a continuous increase in the stock price.
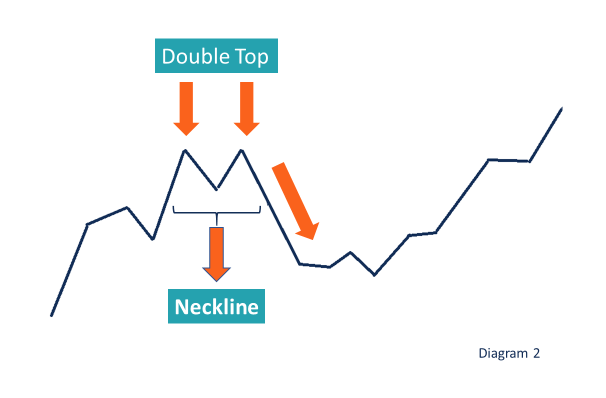
A double top is a reversal of a bearish movement in the stock price. It consists of two peaks. The first peak comes after a bullish movement, after which it goes down to the neckline. It is followed by another bullish movement to reach the second peak.
It is important to note that for a double top, the bearish movement after the second peak should be more significant than the bearish movement after the first peak for the pattern to be termed as a double top.
Investors who trade during a double top usually go short during the second peak in anticipation of a huge fall in price.
As stated earlier, a double bottom reversal is a bullish movement in the stock prices. It contains two lows. When we look at diagram 1 above, the first low comes after a bearish movement in the stock prices followed by a bullish movement to reach the neckline.
The second low comes after and is followed by a bullish movement. It is important to note that the second bullish movement should be more significant than the first bullish movement to attain a double bottom.
Investors trading during the double bottom usually go long during the second low in anticipation of a bullish run.
At point A in diagram 1, traders will use an aggressive strategy by betting for a double bottom. At the second peak, they will assume for the pattern to complete by expecting a bearish movement, thus helping their portfolio to increase in value.
At point B in diagram 1, the double bottom pattern has already taken place. Hence, at this point and beyond, the investor will see a smaller opportunity to earn a higher profit as compared to point A.
At this point, the investors will see much of an advantage to earn a profit, as beyond this point, it will be difficult to know in which direction the prices will go.
CFI offers the Capital Markets & Securities Analyst (CMSA)® certification program for those looking to take their careers to the next level. To keep learning and developing your knowledge base, please explore the additional relevant resources below:


