Get Certified for
Capital Markets (CMSA®)
From equities and fixed income to derivatives, the CMSA certification bridges the gap from where you are now to where you want to be — a world-class capital markets analyst.
A market reversal indicator used in technical analysis trading
The fractal indicator is a trading indicator used in technical analysis that is used to identify potential trend reversal points in a market. It was developed by a renowned trader, Bill Williams, and therefore is also referred to as the Williams Fractal Indicator.
Williams presented the fractal indicator in his book, “Trading Chaos,” noting that his idea for the indicator traces its origins to mathematical chaos theory. In mathematics, fractals are basically any kind of recurring pattern. The premise of the fractal indicator is that you can detect, and potentially profit from, recurring patterns of price movement that occur across various trading time frames (hourly, 4-hour, daily, weekly, etc.).
Using the fractal indicator is essentially the recognition of a pattern in the price action of a traded security. Once the pattern is recognized, traders can then buy or sell, depending on whether the fractal indicator is bullish or bearish, looking to profit from a market reversal.
The fractal pattern, which can be detected on both bar charts and candlestick charts, is comprised of the price action that occurs over the time frame of five candlesticks. Obviously, depending on what charting time frame a trader is using, the absolute amount of time required to form a fractal pattern varies. For a trader using the hourly chart, a fractal pattern can form in five hours – whereas a trader who trades off the daily charts will see fractal patterns that form over the course of five days.
So, what does the fractal indicator look like? One of the advantages of the Williams’ fractal indicator is that it is relatively easy to spot on a chart. The fractal pattern consists of five successive candlesticks, with the middle (third) candlestick representing the highest high or lowest low of the group of five candlesticks, as shown in the image below:
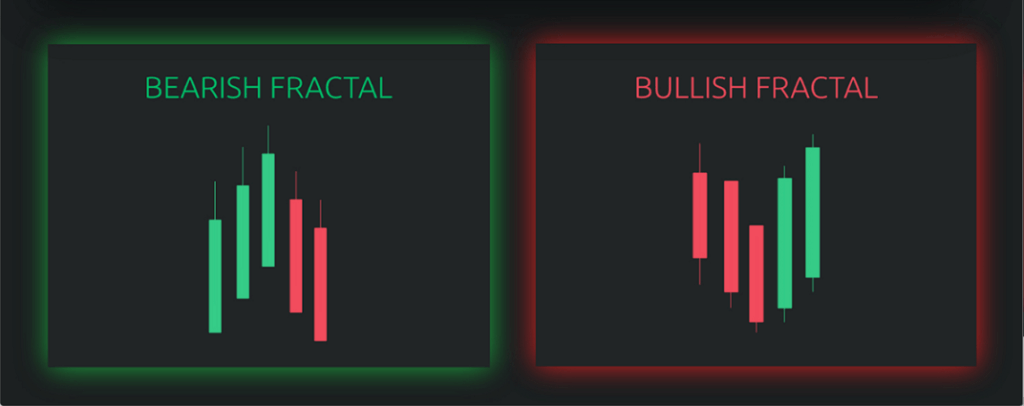
The basic rules for the fractal pattern are as follows:
An alternate way to understand the fractal pattern is:
The fractal pattern reveals a “V” or “U” shaped bottom or top forming in a market – although the pattern is rarely as perfectly clean and symmetrical as the one shown in the image above.
Such a pattern of price action may indicate a market reversal – either a previous uptrending market gradually turning over to the downside, or a previous downtrending market turning to the upside.
At a minimum, a fractal pattern is interpreted as identifying at least a temporary level of price support (bullish fractal) or price resistance (bearish fractal).
Traders frequently view a fractal pattern in relation to other technical support/resistance indicators, such as daily pivot points, in order to evaluate the strength or probable reliability of the fractal indicator’s signal of a trend reversal.
For example, if the high point of a bearish fractal pattern coincides with a Fibonacci retracement level or moving average level that also identifies that price point as a resistance level, then the fractal indicator would be interpreted as being more reliable – more likely to be an accurate indicator of a market reversal.
The fractal pattern must be confirmed by the close of the fifth candlestick in the pattern. In other words, you need to wait through the close of the fifth candlestick in order to see if, in fact, a valid fractal pattern has formed. However, the failure of a fractal indicator to fully form may, itself, be an indicator of a probable future price movement.
For example, assume that four of the five candlesticks showing a bearish fractal pattern have formed, but then the price action represented by the fifth candlestick, rather than showing a lower low than the fourth candlestick, instead shows price advancing to a new high, even well above the high of the third candlestick in the forming pattern. Such price action would not only void the formation of a bearish fractal pattern – it would, in fact, be an indication that the existing uptrend will continue, and that price will continue advancing to higher levels.
The fractal indicator offers the advantages of providing traders with easily identifiable market entry points (at the close of the fifth candlestick in the pattern) and with equally easy-to-spot price points for stop-loss orders.
With a bearish fractal pattern, a trader sells short and then might place a stop-loss order just above the highest high attained in the fractal pattern. With a bullish fractal pattern, a trader buys at the close of the fifth candlestick and may then put their stop-loss order just below the lowest low of the five-candlestick fractal pattern.
A disadvantage of trading off of the fractal indicator is the fact that fractal patterns occur quite frequently in the ordinary course of price action movement – therefore, the indicator is prone to giving traders false signals. That’s why few traders rely solely on the fractal indicator for trading signals, instead of using it in conjunction with other technical indicators.
Another disadvantage of trading the fractal pattern is that it provides less than ideal market entry points. For example, initiating a buy trade at the close of the fifth candlestick in a bullish fractal pattern may result in a trader buying into the market at a price level that is substantially higher than the market low. Furthermore, if the trader then places a stop-loss order below the low of the fractal pattern, the trade’s potential loss may be a monetary amount that is unacceptably high.
CFI is the official provider of the global Capital Markets & Securities Analyst (CMSA®) certification program, designed to help anyone become a world-class financial analyst. The following CFI resources will be helpful in furthering your financial education and advancing your career:


