Get Certified for
Capital Markets (CMSA®)
From equities and fixed income to derivatives, the CMSA certification bridges the gap from where you are now to where you want to be — a world-class capital markets analyst.
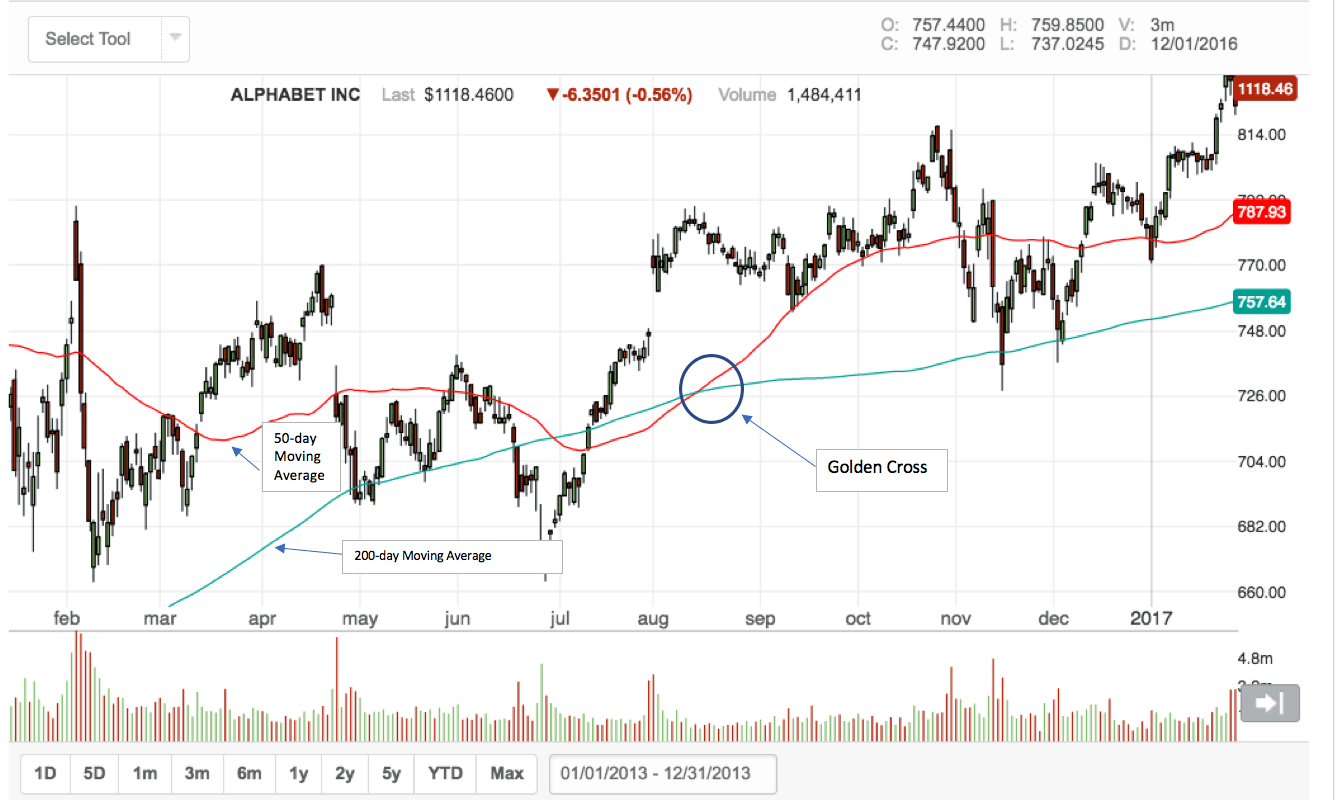
A basic technical indicator that occurs in the market when a shorter-term moving average for assets rises above the longer-term average
A Golden Cross is a basic technical indicator that occurs in the market when a short-term moving average (50-day) of an asset rises above a long-term moving average (200-day). When traders see a Golden Cross occur, they view this chart pattern as indicative of a strong bull market.
Many investors view the Golden Cross as a “holy grail” chart pattern. They consider it one of the most definitive signals of a bull market and, therefore, a strong buy signal. However, there are also analysts who question the validity of the Cross pattern. They do so because of the limited research to detail and prove its legitimacy as a trading mechanism. The most recent evaluation opportunity is in favor of the Golden Cross. Since the pattern last occurred in the S&P 500 Index, the index has gone up by more than 50%
There is a second, converse indicator – the Death Cross – which is the inverse of the Golden Cross. The Death Cross occurs when a security’s 50-day moving average crosses from above to below its 200-day moving average. The Death Cross indicates a bear market going forward.
There are three specific phases for the Golden Cross. The first phase is where a downtrend exists but is on its last legs because selling interest is being overpowered by stronger buying interest.
The second phase involves the emergence of a new uptrend. The breakout of the new uptrend is marked when the short-term average crosses from below to above the long-term average, forming the Golden Cross.
In the final phase, the new uptrend is prolonged, with continuing gains that confirm a bull market. During this phase, the Golden Cross’ two moving averages should both act as support levels when corrective downside retracements occur. As long as both the price and the 50-day average remain above the 200-day average, the bull market is considered to remain intact.
Traders can utilize the Golden Cross to help determine good times to both enter and exit the market. The indicator can also be a tool that traders can use to help them better understand when it makes sense to sell and when it’s better for them to buy and hold.
Traders looking to buy a security will sometimes enter the market when the security’s price rises above the 200-day moving average rather than waiting for the 50-day moving average to make the crossover. This is because the Golden Cross is often a significantly lagging indicator. It may not occur until well after the market has already turned from bearish to bullish.
Traders who sell short the market may use the golden cross as a signal that the bear market is over and it’s time to exit their positions.
The Golden Cross is applied to trading both individual securities and market indexes such as the Dow Jones Industrial Average (DJIA).
Some traders opt to use different moving averages to indicate a Golden Cross. For example, a trader might substitute the 100-day moving average in place of the 200-day. The pattern can also be looked for on shorter time frames, such as an hourly chart.
Finally, many analysts use complementary technical indicators to confirm the indication from a Golden Cross. Momentum indicators such as the Average Directional Index (ADX) or the Relative Strength Index (RSI) are popular choices. This is because momentum indicators are often leading, rather than lagging, indicators. Therefore, they can help in overcoming the Cross pattern’s tendency to significantly lag behind price action.
Some traders and market analysts remain resistant to using the Golden Cross (and the Death Cross) as reliable trading signals. Their objections principally stem from the fact that the Cross pattern is frequently a very lagging indicator. Looking at the chart above, you can see the market bottomed out and turned to the upside at a price level substantially below where the Golden Cross occurred. The Cross pattern may provide limited predictive value for traders and be more valuable as confirmation of an uptrend, rather than as a trend change signal.
The Golden Cross is significant because it is a technical indicator used by many traders and analysts. The chart pattern is, therefore, likely to attract a significant amount of buying in a market. If it does, then it may become a sort of self-fulfilling prophecy. Traders see the pattern and buy the market, and their buying is sufficient to create or sustain a bullish trend.
CFI is a global provider of financial analyst training and oversees the Capital Markets & Securities Analyst (CMSA®) certification program. To continue advancing your career, these additional resources will be helpful:


