Over 2 million + professionals use CFI to learn accounting, financial analysis, modeling and more. Unlock the essentials of corporate finance with our free resources and get an exclusive sneak peek at the first module of each course.
Start Free
What is the Hanging Man Candlestick?
The “hanging man” is a bearish financial candlestick pattern that represents a potential reversal in an uptrend. In particular, a hanging man pattern forms at the end of an uptrend. Due to the uptrend reaching its peak, a reversal is likely to occur. The hanging man candlestick pattern is shown below:
The hanging man also indicates that there was a notable sell-off during the day, which was unable to be pushed back up again by the buyers.
Summary
The “hanging man” is a candlestick pattern that represents a potential reversal in an uptrend.
The hanging man candlestick pattern only occurs if it includes a small real body, long lower shadow, and the asset’s been in an uptrend.
A candlestick is a type of price chart used to display information about a security’s price movement.
How Does the Hanging Man Occur?
The hanging man candlestick pattern only occurs when two criteria are met:
The hanging man candlestick comprises a small real body and a long lower shadow.
The financial asset has been in an uptrend.
When a hanging man candlestick forms in an uptrend, it shows a loss of buyer strength. The hanging man candlestick represents high demand and significant selling. Due to the high demand, buyers can push the stock price near the opening, but a peak is near. The forecasted peak and eventual downtrend provide investors an opportunity to sell existing short positions.
Real Body: The wide, box-like section of a candlestick. It examines if a stock’s closing price was greater or less than its opening price.
Shadow: Sometimes referred to as the wick, a shadow is a line on a candlestick that is used to indicate where the stock price varied relative to the opening and closing prices.
What is a Reversal and an Uptrend?
A reversal is a price direction change of an asset. For example, if an asset was experiencing an uptrend, it would not be beneficial for a reversal to occur. It is because it would change the price direction of an asset downward. For a hanging man candlestick pattern, the reversal is generally short term.
An uptrend represents the upward price movement of an asset.
What is a Candlestick?
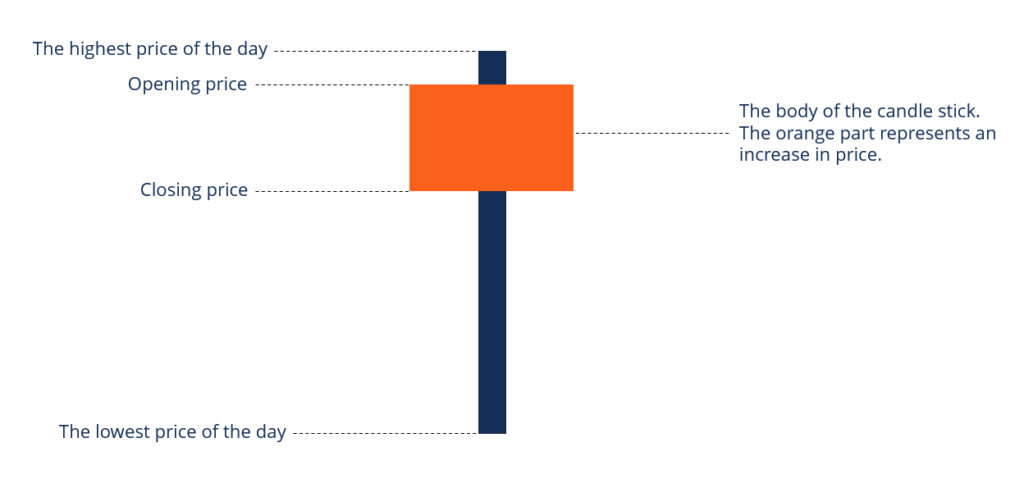
A candlestick refers to a type of price chart that is used in technical analysis to display information about a security’s price movement. A candlestick displays high and low prices of securities, along with their opening and closing prices over a specific period of time.
What are the Features of a Candlestick?
Below are the three basic features of a candlestick that measure security price:
Body: Represents the open-to-close price range.
Wick: Used to indicate intra-day highs and lows.
Color: Reveals the direction of market movement. Green or white candlesticks represent a price increase, while red or black represents a price decrease.
Bearish, Bullish, and Continuation Candlestick Patterns
Candlestick patterns are technical trading tools used in finance to predict price direction. Candlestick patterns are divided into three groups – bearish patterns, bullish patterns, and continuation patterns.
Each of the groups below contains separate indicators on the trajectory of price direction.
Bearish: Most commonly, bearish candlestick patterns form an upward trend and signal a point of reference. Examples of bearish candlestick patterns include the hanging man, shooting star, evening star, three black crows, and the dark cloud cover.
Bullish: In most cases, bullish candlestick patterns form after a downtrend in the market. They are also known to signal a reversal of price movement. Examples of bullish candlestick patterns include the hammer, inverse hammer, piercing line, morning star, and three white soldiers.
Continuation: Continuation candle patterns represent no change in market direction. They can help the trader identify rest periods in the market or when the market trends in a similar direction. Examples of continuation candle patterns include the spinning top, falling three-method, rising three-method, and Doji.
More Resources
CFI offers the Capital Markets & Securities Analyst (CMSA®) certification program for those looking to take their careers to the next level. To keep learning and developing your knowledge base, please explore the additional relevant resources below:
Take your learning and productivity to the next level with our Premium Templates.
Upgrading to a paid membership gives you access to our extensive collection of plug-and-play Templates designed to power your performance—as well as CFI's full course catalog and accredited Certification Programs.
Gain unlimited access to more than 250 productivity Templates, CFI's full course catalog and accredited Certification Programs, hundreds of resources, expert reviews and support, the chance to work with real-world finance and research tools, and more.