Get Certified for
Capital Markets (CMSA®)
From equities and fixed income to derivatives, the CMSA certification bridges the gap from where you are now to where you want to be — a world-class capital markets analyst.
An indication of the uncertainty of the future trend of an asset where the traders are unable to sustain the price of a commodity
Spinning top candlestick is a pattern with a short body between an upper and a lower long wick. The spinning top illustrates a scenario where neither the seller nor the buyer has gained. It results in equal opening and closing price units.
The formation of a spinning top candlestick helps determine the probability of a price reversal especially if it happens after a price decline. Because of the small variation in the market trend, the candlestick is referred to as a continuation pattern.
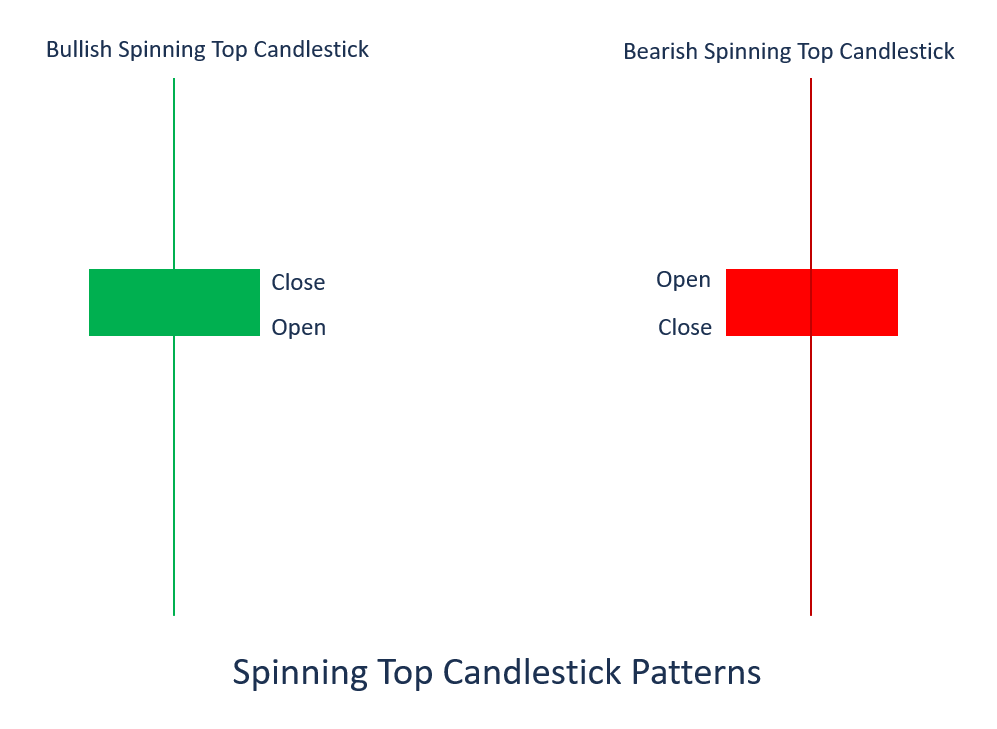
The formation of the candlestick indicates a level of indecision among buyers and sellers, which depicts price reversals, hence creating a neutral pattern. At candle close, the spinning top can be bearish or bullish. However, the pattern of the candlestick is mostly found within an uptrend, a downtrend, and a sideways movement, indicating a potential reversal. The bullish trend increases the price further, while the bearish trend lowers the price until the overall price closes where it opened.
A spinning top occurring at the peak of an uptrend can signify that the bullish is losing track and the trend is about to reverse. However, when a spinning top is at the base of a downtrend, it is a sign that the bearish is losing control, and the bullish may take control. It means that a spinning top may alert about an upcoming crucial change in a trend. However, a confirmation from the next candle is key to determine whether the prices will drop after the uptrend.
Active traders should not trade instantly after the formation of a spinning top but rather wait for the confirmation from technical indicators after the formation of the next candle. It will help eliminate uncertainties in the market since the signal trend reversal will have been established.
For example, during an uptrend, if a bullish occurs after the spinning top at the bottom, the trader could use it as an entry point. Similarly, in an uptrend, if a bearish form at the top in the spinning top pattern, it can be used as an exit point.
Price movements within the spinning top candlestick indicate that buyers and sellers are overriding each other, resulting in homogenous open and close price trends. Using the spinning top pattern in a trading strategy will help the trader work within the minimum suggested investment time.
The idea behind indecision manifested in the market throughout the formation of the spinning top is that buyers and sellers move prices higher and lower during the trading process. It causes the closing price to reverse back closer to the opening price, and the bull trader forces it back to the top before the market closes.
A spinning top indicates exhaustion after a cycle of uptrends or downtrends price pattern. The gap between the opening price and closing price means that no progress was achieved during the timeframe of the candle. The long upper and lower wick displays a higher level of volatility that occurred during the trading period, with neither bulls nor bears dominating.
Most traders use indicators to confirm the signal of a spinning top and gather more facts on the price trends. Trading with the spinning top pattern can be done using derivatives like trading contracts for difference (CFDs). It means that the trader does not need to own the underlying assets but can speculate on their price pattern.
For example, if a trader believes that the spinning top at the support of a downtrend may indicate an approaching reversal, testing the signal will help to predict the price patterns since it indicates the momentum of a specific market at a particular time.
However, a trader needs to apply technical indicators and signals to analyze the trading movements. Such an analysis will protect the trader from straying away from the trading pattern and stick to the risk management plan.
After creating a trading account, the trader should be able to identify a spinning top candlestick with a short body and long wicks on either side and locate the market trend using technical indicators or trend patterns.
However, each trading method comes with varied risk descriptions. Therefore, the trader must indicate the name of the asset they are willing to trade in the search bar. After confirming the upcoming reversal, the trader may proceed and select either the buy or sell option in the trading ticket.
Connect what you just learned to a clear career path with CFI’s role‑based courses and certification programs.
CFI is the official provider of the Capital Markets & Securities Analyst (CMSA)® certification program, designed to transform anyone into a world-class financial analyst.
In order to help you become a world-class financial analyst and advance your career to your fullest potential, these additional resources will be very helpful:


