Get Certified for
Capital Markets (CMSA®)
From equities and fixed income to derivatives, the CMSA certification bridges the gap from where you are now to where you want to be — a world-class capital markets analyst.
A temporary downturn in a stock price or market index following the most recent peak
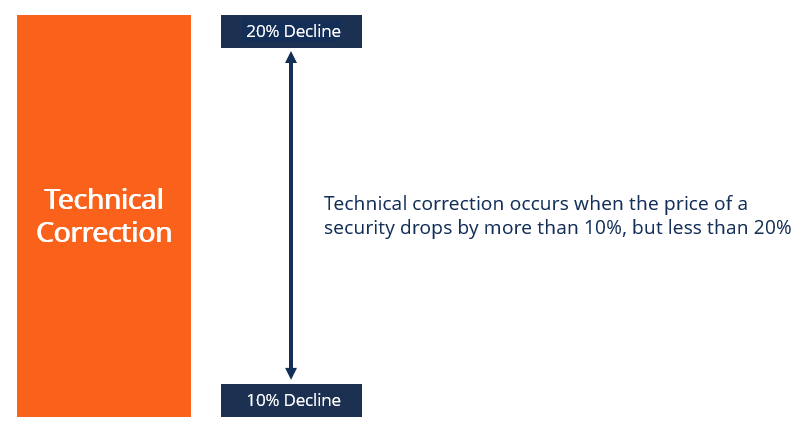
A technical correction is a fall in the stock’s market value by 10% or more but not more than 20% after a series of extensive high gains in the previous closes. Technical correction can apply to individual assets such as bonds, commodities, or stock-market indexes, such as the S&P 500 Index or NASDAQ Index. If the drop exceeds 20%, it is considered a bear market.
The word technical correction stems from the idea that, historically, the price decline often corrects and returns to its longer-term trend. A technical correction can either happen temporarily or for a continuous period. Even so, a normal market correction is usually short-lived and may last between three to four months. Several factors are involved in technical correction, ranging from challenges in a company’s management plan to a large-scale microeconomic shift.
During a technical correction, a consolidative price action occurs to signal the end of a trend. The idea behind a technical correction is to revert to a security’s market value after it is either overly inflated in a bull market or deflated in a bear market. In the earlier case, the security’s price precipitates a selloff, while in the latter, it leads to a buyback, stemming from indecisiveness to trade.
Usually, investors do not know how long the technical correction will last, nor do they see it coming until it is over. While it may cause many worries among investors, especially novice traders, a technical correction is part of long-term investing. It can be anticipated to occur periodically and throughout an investor’s lifetime, with each occurrence having a recovery.
In the trading environment, technical corrections can occur in a number of scenarios. Since it is impossible to point out with a degree of certainty whether a correction will result in either a bearish market or reverse, it is important to keep them in perspective.
Historically, market crashes have led to technical corrections in which the least culminated in bear markets. Bear markets refer to periods when the cumulative market fall is 20% or more from the previous peak close. While technical corrections are worrisome to some investors, they can offer investors an opportunity to pick up quality stock and discount prices, reassess the risk tolerance of their portfolios, and initiate necessary changes tailored to investment objectives.
One of the key challenges to a trader or an investor is to confuse a technical correction with a potential reversal. However, one of the technical analysis goals is to distinguish a technical corrective price action from an apparent price reversal within a continuous trend.
One of the most important developments in the history of technical analysis that can help traders and investors predict a technical correction and discern the difference between technical correction and price reversal is the Dow Theory. Charles Dow first put the theory forward in the 1890s to provide a basis for technical identification. The principles of price actions as set out by the theory are as follows:
The concepts behind the Dow Theory, which underlie the identification of technical correction, are mired in significant controversy in modern times. Notably, its principles were originally based on two stock market average indexes, the rail and industrial. Nevertheless, the principles apply to all market indexes in the present times and can be extended to major financial markets.
Technical analysis uses charts to reveal underperforming indexes that steadily follow each other. Such a pattern may signal that a technical correction is forthcoming. Typically, support and resistance levels are used to project when a price consolidation or a reversal may result in a market correction.
Quite often, technical analysis will come forth when a stock or the whole market gets overinflated. Charting can track the changes and point out overtime adjustments in a market, an asset, or an index. Some of the standard components used in a vast majority of charting platforms include Bollinger Bands for overlaying support and resistance trend lines around candlestick patterns to measure an asset’s price volatility around the mean.
Between 1980 and 2010, 38 corrections took place in the U.S. markets and made rebounds. For example, from the February 19, 2020 peak, the S&P 500 plummeted by 34% due to the COVID-19 pandemic. The declines were so spontaneous that automatic circuit brakes kicked in several times, alongside other stimulus measures from the Federal Reserve and the U.S. Government. However, S&P 500 staged a steady recovery, wiping off the sell-offs.
CFI is the official provider of the global Capital Markets & Securities Analyst (CMSA)® certification program, designed to help anyone become a world-class financial analyst. To keep advancing your career, the additional CFI resources below will be useful:


